Sony 1998 Annual Report Download - page 75
Download and view the complete annual report
Please find page 75 of the 1998 Sony annual report below. You can navigate through the pages in the report by either clicking on the pages listed below, or by using the keyword search tool below to find specific information within the annual report.-
 1
1 -
2
-
3
-
4
-
5
-
6
-
7
-
8
-
9
-
10
-
11
-
12
-
13
-
14
-
15
-
16
-
17
-
18
-
19
-
20
-
21
-
22
-
23
-
24
-
25
-
26
-
27
-
28
-
29
-
30
-
31
-
32
-
33
-
34
-
35
-
36
-
37
-
38
-
39
-
40
-
41
-
42
-
43
-
44
-
45
-
46
-
47
-
48
-
49
-
50
-
51
-
52
-
53
-
54
-
55
-
56
-
57
-
58
-
59
-
60
-
61
-
62
-
63
-
64
-
 65
65 -
 66
66 -
 67
67 -
 68
68 -
 69
69 -
 70
70 -
 71
71 -
 72
72 -
 73
73 -
 74
74 -
 75
75 -
 76
76 -
 77
77 -
 78
78 -
 79
79 -
 80
80
 |
 |

Annual Report 1998 Sony Corporation [73]
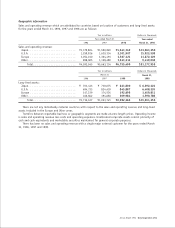
Geographic information
Sales and operating revenue which are attributed to countries based on location of customers and long-lived assets
for the years ended March 31, 1996, 1997 and 1998 are as follows:
Yen in millions Dollars in thousands
Year ended March 31 Year ended
1996 1997 1998 March 31, 1998
Sales and operating revenue:
Japan . . . . . . . . . . . . . . . . . . . . . . . . . . . . ¥1,379,804 ¥1,590,820 ¥1,843,149 $13,963,250
U.S.A. . . . . . . . . . . . . . . . . . . . . . . . . . . . 1,259,926 1,639,334 2,101,907 15,923,538
Europe . . . . . . . . . . . . . . . . . . . . . . . . . . . 1,054,010 1,304,491 1,567,121 11,872,129
Other . . . . . . . . . . . . . . . . . . . . . . . . . . . . 898,825 1,128,489 1,243,313 9,419,038
Total . . . . . . . . . . . . . . . . . . . . . . . . . ¥4,592,565 ¥5,663,134 ¥6,755,490 $51,177,955
Yen in millions Dollars in thousands
March 31 March 31,
1996 1997 1998 1998
Long-lived assets:
Japan . . . . . . . . . . . . . . . . . . . . . . . . . . . . ¥ 701,413 ¥ 730,075 ¥ 843,800 $ 6,392,424
U.S.A. . . . . . . . . . . . . . . . . . . . . . . . . . . . 694,733 824,439 845,887 6,408,235
Europe . . . . . . . . . . . . . . . . . . . . . . . . . . . 147,339 174,524 192,695 1,459,811
Other . . . . . . . . . . . . . . . . . . . . . . . . . . . . 166,842 194,683 209,984 1,590,788
Total . . . . . . . . . . . . . . . . . . . . . . . . . ¥1,710,327 ¥1,923,721 ¥2,092,366 $15,851,258
There are not any individually material countries with respect to the sales and operating revenue and long-lived
assets included in the Europe and Other areas.
Transfers between reportable business or geographic segments are made at arms-length prices. Operating income
is sales and operating revenue less costs and operating expenses. Unallocated corporate assets consist primarily of
cash and cash equivalents and marketable securities maintained for general corporate purposes.
There has been no sales and operating revenue with a single major external customer for the years ended March
31, 1996, 1997 and 1998.