Sony 1998 Annual Report Download - page 51
Download and view the complete annual report
Please find page 51 of the 1998 Sony annual report below. You can navigate through the pages in the report by either clicking on the pages listed below, or by using the keyword search tool below to find specific information within the annual report.-
 1
1 -
2
-
3
-
4
-
5
-
6
-
7
-
8
-
9
-
10
-
11
-
12
-
13
-
14
-
15
-
16
-
17
-
18
-
19
-
20
-
21
-
22
-
23
-
24
-
25
-
26
-
27
-
28
-
29
-
30
-
31
-
32
-
33
-
34
-
35
-
36
-
37
-
38
-
39
-
40
-
 41
41 -
 42
42 -
 43
43 -
 44
44 -
 45
45 -
 46
46 -
 47
47 -
 48
48 -
 49
49 -
 50
50 -
 51
51 -
 52
52 -
 53
53 -
 54
54 -
 55
55 -
 56
56 -
 57
57 -
 58
58 -
 59
59 -
 60
60 -
 61
61 -
62
-
63
-
64
-
65
-
66
-
67
-
68
-
69
-
70
-
71
-
72
-
73
-
74
-
75
-
76
-
77
-
78
-
79
-
80
 |
 |

Annual Report 1998 Sony Corporation [49]
Dollars in
Yen in millions thousands**
1994 1995 1996 1997 1998 1998
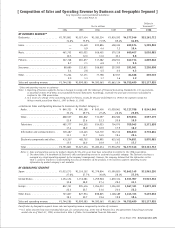
BY BUSINESS SEGMENT*
Electronics . . . . . . . . . . . . . . . . . . ¥2,791,881 ¥3,027,434 ¥3,283,234 ¥3,930,292 ¥4,377,346 $33,161,712
74.6% 75.9% 71.5% 69.4% 64.8%
Game . . . . . . . . . . . . . . . . . . . . . . — 35,449 200,894 408,335 699,574 5,299,803
— 0.9 4.4 7.2 10.4
Music. . . . . . . . . . . . . . . . . . . . . . 461,752 481,021 506,455 570,119 660,407 5,003,083
12.3 12.0 11.0 10.1 9.8
Pictures . . . . . . . . . . . . . . . . . . . . 327,748 281,677 317,382 438,551 642,714 4,869,046
8.7 7.1 6.9 7.7 9.5
Insurance . . . . . . . . . . . . . . . . . . . 88,680 112,831 206,802 227,920 291,061 2,205,008
2.4 2.8 4.5 4.0 4.3
Other . . . . . . . . . . . . . . . . . . . . . . 74,224 52,171 77,798 87,917 84,388 639,303
2.0 1.3 1.7 1.6 1.2
Sales and operating revenue . . . . . . ¥3,744,285 ¥3,990,583 ¥4,592,565 ¥5,663,134 ¥6,755,490 $51,177,955
* Sales and operating revenue to customers
Notes: 1. Reporting of business segments has been changed to comply with the Statement of Financial Accounting Standards No. 131 requirements,
as described in Note 19 of Notes to Consolidated Financial Statements. Accordingly, results for the prior years have been reclassified to
conform to the 1998 presentation.
2. As a result of a change in the accounting period in Pictures, results for the year ended March 31, 1998 in the segment include the
thirteen-month period from March 1, 1997 to March 31, 1998.
« Electronics Sales and Operating Revenue to Customers by Product Category »
Audio . . . . . . . . . . . . . . . . . . . . ¥ 840,723 ¥ 900,180 ¥ 900,400 ¥1,029,961 ¥1,127,788 $ 8,543,848
30.1% 29.7% 27.4% 26.2% 25.8%
Video . . . . . . . . . . . . . . . . . . . . 668,537 685,802 731,097 816,582 870,854 6,597,379
23.9 22.6 22.3 20.8 19.9
Televisions . . . . . . . . . . . . . . . . 485,777 544,255 554,023 704,075 709,043 5,371,538
17.4 18.0 16.9 17.9 16.2
Information and communications . . 365,487 413,445 540,719 764,512 894,810 6,778,864
13.1 13.7 16.5 19.4 20.4
Electronic components and other . . 431,357 483,752 556,995 615,162 774,851 5,870,083
15.5 16.0 16.9 15.7 17.7
Total . . . . . . . . . . . . . . . . . . . . ¥2,791,881 ¥3,027,434 ¥3,283,234 ¥3,930,292 ¥4,377,346 $33,161,712
Notes: 1. Sales and operating revenue by product category for the prior years have been reclassified to conform to the 1998 presentation.
2. The above table is a breakdown of Electronics sales and operating revenue to customers by product category. The Electronics business is
managed as a single operating segment by the company’s management. However, the company believes that the information in this
table is useful to investors in understanding the sales contributions of the products in this business segment. Operating income
information by product category is not available.
BY GEOGRAPHIC SEGMENT
Japan . . . . . . . . . . . . . . . . . . . . . ¥1,033,273 ¥1,105,152 ¥1,379,804 ¥1,590,820 ¥1,843,149 $13,963,250
27.6% 27.7% 30.0% 28.1% 27.3%
United States . . . . . . . . . . . . . . . . 1,154,454 1,152,081 1,259,926 1,639,334 2,101,907 15,923,538
30.8 28.9 27.4 29.0 31.1
Europe . . . . . . . . . . . . . . . . . . . . . 832,751 905,416 1,054,010 1,304,491 1,567,121 11,872,129
22.3 22.7 23.0 23.0 23.2
Other Areas . . . . . . . . . . . . . . . . . 723,807 827,934 898,825 1,128,489 1,243,313 9,419,038
19.3 20.7 19.6 19.9 18.4
Sales and operating revenue . . . . . . ¥3,744,285 ¥3,990,583 ¥4,592,565 ¥5,663,134 ¥6,755,490 $51,177,955
Classification by Geographic segment shows sales and operating revenue recognized by location of customers.
** U.S. dollar amounts have been translated from yen, for convenience only, at the rate of ¥132=U.S.$1, the approximate Tokyo foreign exchange
market rate as of March 31, 1998, as described in Note 3 of Notes to Consolidated Financial Statements.
[ Composition of Sales and Operating Revenue by Business and Geographic Segment ]
Sony Corporation and Consolidated Subsidiaries
Year ended March 31