Sony 1998 Annual Report Download - page 41
Download and view the complete annual report
Please find page 41 of the 1998 Sony annual report below. You can navigate through the pages in the report by either clicking on the pages listed below, or by using the keyword search tool below to find specific information within the annual report.-
 1
1 -
2
-
3
-
4
-
5
-
6
-
7
-
8
-
9
-
10
-
11
-
12
-
13
-
14
-
15
-
16
-
17
-
18
-
19
-
20
-
21
-
22
-
23
-
24
-
25
-
26
-
27
-
28
-
29
-
30
-
 31
31 -
 32
32 -
 33
33 -
 34
34 -
 35
35 -
 36
36 -
 37
37 -
 38
38 -
 39
39 -
 40
40 -
 41
41 -
 42
42 -
 43
43 -
 44
44 -
 45
45 -
 46
46 -
 47
47 -
 48
48 -
 49
49 -
 50
50 -
 51
51 -
52
-
53
-
54
-
55
-
56
-
57
-
58
-
59
-
60
-
61
-
62
-
63
-
64
-
65
-
66
-
67
-
68
-
69
-
70
-
71
-
72
-
73
-
74
-
75
-
76
-
77
-
78
-
79
-
80
 |
 |
Annual Report 1998 Sony Corporation [39]
Effective for the fiscal year ended March 31, 1998, Sony adopted Statement of Financial Accounting Standards No.
131 (FAS 131). This resulted in the reporting of business results based on new operating segments (refer to Note 19
of Notes to Consolidated Financial Statements). Segment information as well as certain items in the consolidated
statements of income in prior fiscal years have been reclassified to conform to the presentation for the fiscal year
ended March 31, 1998.
Sony also adopted FAS 128 during the fiscal year ended March 31, 1998. FAS 128 requires presentation of basic
and diluted net income per share on the face of the statements of income (refer to Notes 2 and 4 of Notes to
Consolidated Financial Statements). Net income per share amounts in prior fiscal years have been restated to conform
with FAS 128.
RESULTS OF OPERATIONS
During the fiscal year ended March 31, 1998, Sony achieved record consolidated sales and operating revenue (herein
referred to as “sales”) and earnings for the second consecutive fiscal year.
Sales
Consolidated sales and operating revenue rose 19.3% compared with the previous fiscal year, to ¥6,755.5 billion
($51,178 million). This performance reflects sales growth across all business segments as well as the yen’s depreciation.
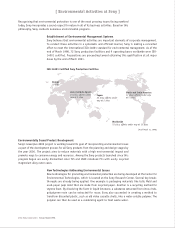
Impact of Foreign Exchange Trends
During the year under review, overseas (outside Japan) sales accounted for approximately 73% of Sony’s consolidated
sales. During the year, the yen depreciated approximately 8% against the U.S. dollar and 11% against the British
pound, but appreciated approximately 5% against the German mark, each in terms of average rates, compared with
the previous fiscal year. It is estimated that sales and operating income would have been lower by approximately
¥291 billion ($2,205 million) and ¥110 billion ($833 million), respectively, than the reported figures if the average
value of the yen had remained the same as in the previous fiscal year. Note that these estimates are obtained by
simply applying the yen’s average exchange rate in the prior fiscal year to foreign currency denominated sales, cost of
sales, and selling, general and administrative expenses of the year under review. Therefore, the estimate does not take
into account the effect of foreign exchange fluctuations on prices of products and production and sales costs in each
region of the world.
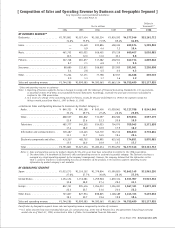
[ Financial Review ]
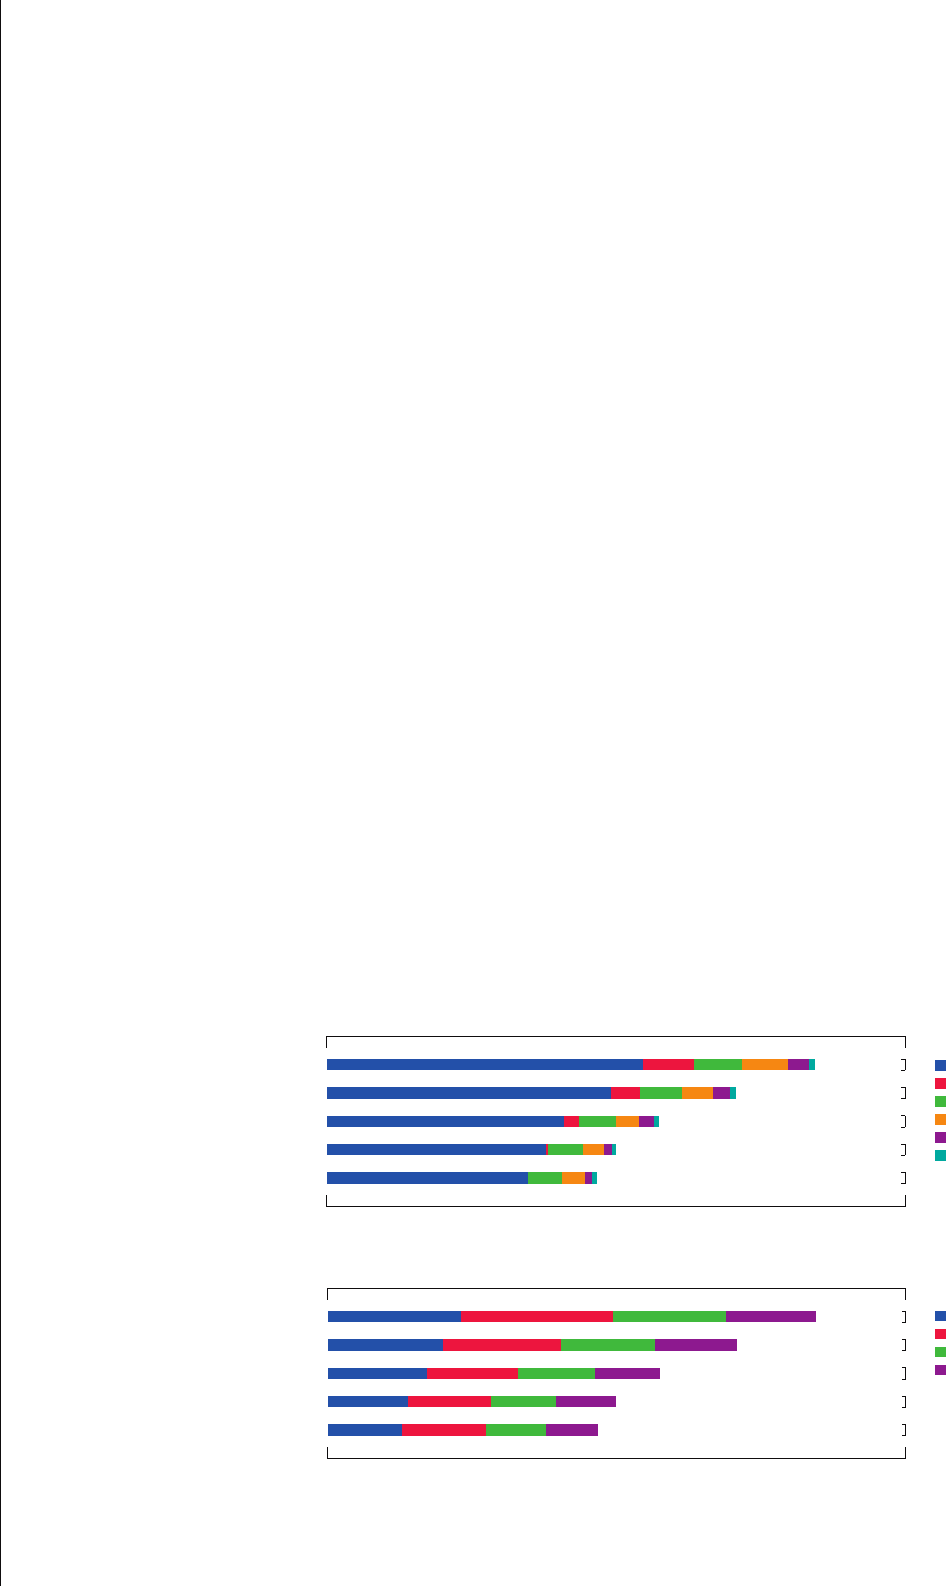
Sales and Operating Revenue by Business Segment (Percent of Consolidated Sales)*
(Billion ¥, %)
Electronics
Game
Music
Pictures
Insurance
Other
Japan
United States
Europe
Other Areas
94 3,744
95
96
97
98
3,991
4,593
5,663
6,755
(74.6) (12.3) (8.7)(2.4)(2.0)
(75.9) (0.9) (12.0) (7.1) (2.8)(1.3)
(71.5) (4.4) (11.0) (6.9) (4.5) (1.7)
(69.4) (7.2) (10.1) (7.7) (4.0) (1.6)
(64.8) (10.4) (9.8) (9.5) (4.3) (1.2)
Sales and Operating Revenue by Geographic Segment (Percent of Consolidated Sales)**
(Billion ¥, %)
94 3,744
95
96
97
98
3,991
4,593
5,663
6,755
(27.3)
(28.1)
(30.0)
(27.7)
(27.6)
(23.2)
(23.0)
(23.0)
(22.7)
(22.3)
(31.1)
(29.0)
(27.4)
(28.9)
(30.8)
(18.4)
(19.9)
(19.6)
(20.7)
(19.3)
* Sales and operating revenue to customers
** Sales and operating revenue by location of customers