Sony 1998 Annual Report Download - page 74
Download and view the complete annual report
Please find page 74 of the 1998 Sony annual report below. You can navigate through the pages in the report by either clicking on the pages listed below, or by using the keyword search tool below to find specific information within the annual report.-
 1
1 -
2
-
3
-
4
-
5
-
6
-
7
-
8
-
9
-
10
-
11
-
12
-
13
-
14
-
15
-
16
-
17
-
18
-
19
-
20
-
21
-
22
-
23
-
24
-
25
-
26
-
27
-
28
-
29
-
30
-
31
-
32
-
33
-
34
-
35
-
36
-
37
-
38
-
39
-
40
-
41
-
42
-
43
-
44
-
45
-
46
-
47
-
48
-
49
-
50
-
51
-
52
-
53
-
54
-
55
-
56
-
57
-
58
-
59
-
60
-
61
-
62
-
63
-
 64
64 -
 65
65 -
 66
66 -
 67
67 -
 68
68 -
 69
69 -
 70
70 -
 71
71 -
 72
72 -
 73
73 -
 74
74 -
 75
75 -
 76
76 -
 77
77 -
 78
78 -
 79
79 -
 80
80
 |
 |

[72] Sony Corporation Annual Report 1998
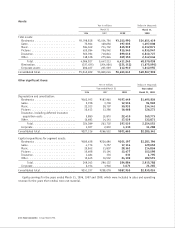
Assets:
Yen in millions Dollars in thousands
March 31 March 31,
1996 1997 1998 1998
Total assets:
Electronics . . . . . . . . . . . . . . . . . . . . . . . . ¥2,798,818 ¥3,014,756 ¥3,253,990 $24,651,439
Game . . . . . . . . . . . . . . . . . . . . . . . . . . . . 75,964 128,056 197,605 1,497,008
Music . . . . . . . . . . . . . . . . . . . . . . . . . . . . 594,949 714,792 835,939 6,332,871
Pictures . . . . . . . . . . . . . . . . . . . . . . . . . . 635,284 796,942 915,545 6,935,947
Insurance . . . . . . . . . . . . . . . . . . . . . . . . . 563,784 716,843 899,016 6,810,727
Other . . . . . . . . . . . . . . . . . . . . . . . . . . . . 318,128 275,824 309,150 2,342,046
Total . . . . . . . . . . . . . . . . . . . . . . . . . 4,986,927 5,647,213 6,411,245 48,570,038
Elimination . . . . . . . . . . . . . . . . . . . . . . . . (227,635) (204,006) (221,112) (1,675,091)
Corporate assets . . . . . . . . . . . . . . . . . . . . 286,407 237,039 212,910 1,612,955
Consolidated total . . . . . . . . . . . . . . . . . . . . . ¥5,045,699 ¥5,680,246 ¥6,403,043 $48,507,902
Other significant items:
Yen in millions Dollars in thousands
Year ended March 31 Year ended
1996 1997 1998 March 31, 1998
Depreciation and amortization:
Electronics . . . . . . . . . . . . . . . . . . . . . . . . ¥162,592 ¥187,960 ¥197,449 $1,495,826
Game . . . . . . . . . . . . . . . . . . . . . . . . . . . . 2,198 3,738 12,536 94,969
Music . . . . . . . . . . . . . . . . . . . . . . . . . . . . 22,323 28,707 30,933 234,341
Pictures . . . . . . . . . . . . . . . . . . . . . . . . . . 10,613 13,286 16,668 126,273
Insurance, including deferred insurance
acquisition costs . . . . . . . . . . . . . . . . . . . 9,880 15,870 22,410 169,773
Other . . . . . . . . . . . . . . . . . . . . . . . . . . . . 16,683 14,141 17,539 132,871
Total . . . . . . . . . . . . . . . . . . . . . . . . . 224,289 263,702 297,535 2,254,053
Corporate . . . . . . . . . . . . . . . . . . . . . . . . . 3,027 2,830 4,130 31,288
Consolidated total . . . . . . . . . . . . . . . . . . . . . ¥227,316 ¥266,532 ¥301,665 $2,285,341
Capital expenditures for segment assets:
Electronics . . . . . . . . . . . . . . . . . . . . . . . . ¥185,638 ¥226,696 ¥301,197 $2,281,796
Game . . . . . . . . . . . . . . . . . . . . . . . . . . . . 4,776 5,757 17,114 129,652
Music . . . . . . . . . . . . . . . . . . . . . . . . . . . . 25,842 31,807 28,361 214,856
Pictures . . . . . . . . . . . . . . . . . . . . . . . . . . 15,658 15,194 13,477 102,098
Insurance . . . . . . . . . . . . . . . . . . . . . . . . . 1,484 176 633 4,795
Other . . . . . . . . . . . . . . . . . . . . . . . . . . . . 15,645 16,502 24,102 182,591
Total . . . . . . . . . . . . . . . . . . . . . . . . . 249,043 296,132 384,884 2,915,788
Corporate . . . . . . . . . . . . . . . . . . . . . . . . . 2,154 1,946 3,071 23,265
Consolidated total . . . . . . . . . . . . . . . . . . . . . ¥251,197 ¥298,078 ¥387,955 $2,939,053
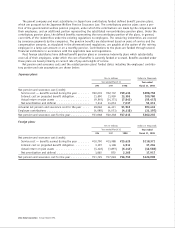
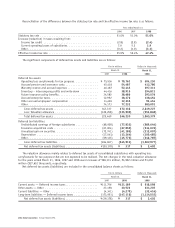
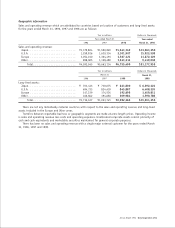
Equity earnings for the years ended March 31, 1996, 1997 and 1998, which were included in sales and operating
revenue for the years then ended, were not material.