Sony 1998 Annual Report Download - page 45
Download and view the complete annual report
Please find page 45 of the 1998 Sony annual report below. You can navigate through the pages in the report by either clicking on the pages listed below, or by using the keyword search tool below to find specific information within the annual report.-
 1
1 -
2
-
3
-
4
-
5
-
6
-
7
-
8
-
9
-
10
-
11
-
12
-
13
-
14
-
15
-
16
-
17
-
18
-
19
-
20
-
21
-
22
-
23
-
24
-
25
-
26
-
27
-
28
-
29
-
30
-
31
-
32
-
33
-
34
-
 35
35 -
 36
36 -
 37
37 -
 38
38 -
 39
39 -
 40
40 -
 41
41 -
 42
42 -
 43
43 -
 44
44 -
 45
45 -
 46
46 -
 47
47 -
 48
48 -
 49
49 -
 50
50 -
 51
51 -
 52
52 -
 53
53 -
 54
54 -
 55
55 -
56
-
57
-
58
-
59
-
60
-
61
-
62
-
63
-
64
-
65
-
66
-
67
-
68
-
69
-
70
-
71
-
72
-
73
-
74
-
75
-
76
-
77
-
78
-
79
-
80
 |
 |

Annual Report 1998 Sony Corporation [43]
Other
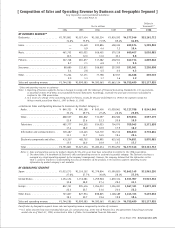
The Other segment consists of various operating activities including customer financing, leasing, broadcasting, net-
working, and other businesses. Sales in the Other segment grew 3.3% to ¥248.2 billion ($1,881 million) and operat-
ing loss increased to ¥10.3 billion ($78 million) from the prior year’s operating loss of ¥1.4 billion. This increase in
the operating loss was due to higher costs incurred in the start-up of new businesses including location based
entertainment businesses, satellite distribution services, and internet-related businesses.
Outlook
In the fiscal year ending March 31, 1999, Sony will continue its efforts to further improve business results. However,
the operating environment has become increasingly challenging. Based on business conditions and management’s
outlook as of May 7, 1998, Sony estimates flat sales and moderately lower earnings compared to the fiscal year ended
March 31, 1998. The major factors contributing to this estimate are as follows.
Based on the assumption that the average yen-dollar exchange rate until the end of the fiscal year ending March
31, 1999 will be around ¥125, a smaller benefit is expected from the yen’s depreciation. In the Electronics segment,
sales are forecast to continue to be weak in Brazil and Asian countries, and to slow in Japan. Also, conditions in
semiconductor markets are not expected to improve in the near-term. The Game business is forecast to experience a
decline in profitability due to factors including an increase in R&D expenses. In the Other segment, new business
areas such as digital satellite broadcasting remain in start-up stages and are expected to generate a loss.
A depreciation of the yen from the assumption in Sony’s forecasts against various currencies in terms of average
rates would be anticipated to have a positive impact on Sony’s performance.
FINANCIAL POSITION AND LIQUIDITY
Total assets at March 31, 1998 were ¥6,403.0 billion ($48,508 million), 12.7% more than at the previous fiscal year-
end. One reason for the increase was the yen’s depreciation at the end of the year compared with the previous fiscal
year-end. Among current assets, cash and time deposits rose mostly due to the higher earnings, and marketable
securities increased as the parent company raised short-term investments. Notes and accounts receivable increased as
sales grew. While growth in sales resulted in increases in inventories, the inventory turnover ratio to cost of sales
(based on the average of inventories at March 31, 1997 and 1998) improved by 0.22 month to 2.42 months resulting
from efforts to shorten product lead-times from manufacture to sale. The increase in investments and advances was due
to higher investment assets at Sony Life Insurance Co., Ltd. as insurance premium revenues posted strong growth.
Total current and long-term liabilities increased 8.7% to ¥4,461.7 billion ($33,801 million). Among current
liabilities, short-term borrowings and debt declined sharply, mainly due to the redemptions of medium-term notes
(MTN) issued by a U.S. subsidiary and maturing during the year. Repayment of MTN was refinanced through
commercial paper (CP) issued by the subsidiary. By the end of this fiscal year, most of the outstanding CP was repaid
using proceeds from the U.S.$1.5 billion Notes issued in March 1998. Notes and accounts payable, trade and accounts
payable, other and accrued expenses increased due to the growth in Sony’s businesses. Among long-term liabilities,
long-term debt increased only slightly despite the Notes issue because of the conversion of ¥146.5 billion ($1,110
million) of convertible bonds into common stock during the year. As a result, total short- and long-term borrowings
and debt amounted to ¥1,303.8 billion ($9,878 million), 8.7% less than the previous fiscal year-end. The increase in
accrued pension and severance costs resulted from a reduction in the assumed discount rate used in developing
projected benefit obligations for the Japanese plans, due to a decline in long-term interest rates in Japan for the past
few years, and from the minimum pension liability recognized at March 31, 1998 (refer to Note 13 of Notes to
Consolidated Financial Statements). Future insurance policy benefits were higher because of growth in insurance
premium revenues at Sony Life Insurance Co., Ltd.
Stockholders’ equity increased 24.4% to ¥1,815.6 billion ($13,754 million), mostly because of higher earnings
and the conversion of convertible bonds. The ratio of stockholders’ equity to total assets increased by 2.7 percentage
points, from 25.7% to 28.4%. Based on the number of shares outstanding at March 31, 1998, stockholders’ equity
per share rose to ¥4,461.39 ($33.80) from ¥3,798.62 at the previous fiscal year-end. In addition, the cumulative
translation adjustment at March 31, 1998 decreased in absolute amount to ¥140.7 billion ($1,066 million) from
¥181.2 billion at the previous fiscal year-end mainly due to the yen’s depreciation.