Sony 1998 Annual Report Download - page 44
Download and view the complete annual report
Please find page 44 of the 1998 Sony annual report below. You can navigate through the pages in the report by either clicking on the pages listed below, or by using the keyword search tool below to find specific information within the annual report.-
 1
1 -
2
-
3
-
4
-
5
-
6
-
7
-
8
-
9
-
10
-
11
-
12
-
13
-
14
-
15
-
16
-
17
-
18
-
19
-
20
-
21
-
22
-
23
-
24
-
25
-
26
-
27
-
28
-
29
-
30
-
31
-
32
-
33
-
 34
34 -
 35
35 -
 36
36 -
 37
37 -
 38
38 -
 39
39 -
 40
40 -
 41
41 -
 42
42 -
 43
43 -
 44
44 -
 45
45 -
 46
46 -
 47
47 -
 48
48 -
 49
49 -
 50
50 -
 51
51 -
 52
52 -
 53
53 -
 54
54 -
55
-
56
-
57
-
58
-
59
-
60
-
61
-
62
-
63
-
64
-
65
-
66
-
67
-
68
-
69
-
70
-
71
-
72
-
73
-
74
-
75
-
76
-
77
-
78
-
79
-
80
 |
 |
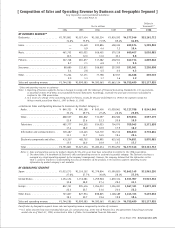
[42] Sony Corporation Annual Report 1998
Electronics
During the year, despite weak markets in Brazil and Asia, including China, many hit products and the yen’s deprecia-
tion helped to increase Electronics sales by 13.5% to ¥4,690.1 billion ($35,531 million). Sales growth, cost reduc-
tions, and the yen’s depreciation contributed to an increase in operating income of 31.4% to ¥314.5 billion ($2,383
million). As a percentage of sales in the segment, operating income improved by 0.9 percentage point, to 6.7%.
However, late in the fiscal year, the business environment in Electronics became more difficult due to a deterioration
in the semiconductor business and slowing sales in Southeast Asia. Sales in Japan, where Sony had attained steady
growth despite sluggish market conditions, also slowed toward the end of the fiscal year.
Breaking down Electronics sales to customers by product category, “Audio” products sales grew by 9.5% to ¥1,127.8
billion ($8,544 million) due to sales expansion of MiniDisc systems while sales of Walkman headphone stereos de-
creased. Sales also expanded 6.6% to ¥870.9 billion ($6,597 million) in the “Video” category, as demand grew for
home-use digital camcorders and the Digital Mavica still camera. Although the highly successful Wega series of color
TVs in Japan, which incorporate flat cathode ray tubes, contributed to sales in “Televisions”, the category overall
increased only 0.7% to ¥709.0 billion ($5,372 million), due to sluggishness in Brazil and Asia, including China. Despite
a slowing of computer display sales caused by weakness in PC markets, sales in the “Information and communications”
category increased 17.0% to ¥894.8 billion ($6,779 million), boosted by the popularity of new VAIO notebook PCs in
Japan, and expansion of digital cellular phone sales in Japan, the United States, and Europe. In the “Electronic
components and other” category, sales grew 26.0% to ¥774.9 billion ($5,870 million) primarily due to higher sales in
electronic components such as optical pickups, more than offsetting declining demand for memory chips.
Game
Sales in the Game business jumped by 72.3%, to ¥722.6 billion ($5,474 million), on extremely strong demand for
PlayStation game consoles and software worldwide. Operating income in this business segment more than doubled
from the previous fiscal year, reaching ¥116.9 billion ($886 million) and rose by 2.6 percentage points, to 16.2% of
sales. During the year, worldwide production shipments of PlayStation game consoles increased to 19.37 million units
compared with 9.2 million units in the previous fiscal year. As of March 31, 1998, cumulative production shipments
to markets worldwide have reached 32.82 million consoles and 236 million software units.
Music
Sony’s Music business continued to post strong results as revenue increased 17.3% to ¥694.7 billion ($5,263 million)
and operating income increased 19.6% to ¥54.1 billion ($410 million). As a percentage of sales, operating income
improved by 0.2 percentage point, to 7.8%. The Music group performed strongly throughout most territories around
the world. Global bestsellers, combined with local artist successes worldwide, contributed to the year’s results, more
than offsetting lower results from direct marketing operations in the United States.
Pictures
Sony’s Pictures business recorded strong results. Revenue increased 46.7% to ¥643.2 billion ($4,872 million). Sales
increased significantly over the prior year, benefiting from record motion picture box office revenue and strong sell-
through video sales, as well as the inclusion of 13 months of activity from March 1, 1997 to March 31, 1998 due to a
change in the Pictures group fiscal year. In television operations, the group benefited from continued strong perfor-
mance from its game shows and soap operas as well as network and syndication revenue. Operating income was up
22.9% to ¥35.5 billion ($269 million), but declined 1.1 percentage points, to 5.5% of sales. This was mainly due to
the start-up losses on new international television ventures and losses due to the underutilization of its special
effects studio.
Insurance
Insurance revenue increased 27.7% to ¥291.1 billion ($2,205 million), reflecting the expansion of Sony’s life insur-
ance business in Japan. In this segment, operating income grew 6.4% to ¥20.3 billion ($154 million) and declined
1.4 percentage points, to 7.0% of sales. The lower operating margin was primarily due to an increase in amortization
of deferred insurance acquisition costs and higher expenses such as benefit payments at Sony Life Insurance Co., Ltd.