Sony 1998 Annual Report Download - page 73
Download and view the complete annual report
Please find page 73 of the 1998 Sony annual report below. You can navigate through the pages in the report by either clicking on the pages listed below, or by using the keyword search tool below to find specific information within the annual report.-
 1
1 -
2
-
3
-
4
-
5
-
6
-
7
-
8
-
9
-
10
-
11
-
12
-
13
-
14
-
15
-
16
-
17
-
18
-
19
-
20
-
21
-
22
-
23
-
24
-
25
-
26
-
27
-
28
-
29
-
30
-
31
-
32
-
33
-
34
-
35
-
36
-
37
-
38
-
39
-
40
-
41
-
42
-
43
-
44
-
45
-
46
-
47
-
48
-
49
-
50
-
51
-
52
-
53
-
54
-
55
-
56
-
57
-
58
-
59
-
60
-
61
-
62
-
 63
63 -
 64
64 -
 65
65 -
 66
66 -
 67
67 -
 68
68 -
 69
69 -
 70
70 -
 71
71 -
 72
72 -
 73
73 -
 74
74 -
 75
75 -
 76
76 -
 77
77 -
 78
78 -
 79
79 -
 80
80
 |
 |

Annual Report 1998 Sony Corporation [71]
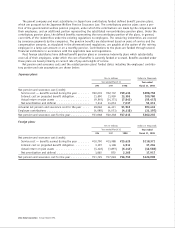
Business segments
Sales and operating revenue:
Yen in millions Dollars in thousands
Year ended March 31 Year ended
1996 1997 1998 March 31, 1998
Sales and operating revenue:
Electronics —
Customers . . . . . . . . . . . . . . . . . . . . . . . ¥3,283,234 ¥3,930,292 ¥4,377,346 $33,161,712
Intersegment . . . . . . . . . . . . . . . . . . . . . 182,222 201,339 312,764 2,369,424
Total . . . . . . . . . . . . . . . . . . . . . . . . . 3,465,456 4,131,631 4,690,110 35,531,136
Game —
Customers . . . . . . . . . . . . . . . . . . . . . . . 200,894 408,335 699,574 5,299,803
Intersegment . . . . . . . . . . . . . . . . . . . . . 3,017 10,943 22,977 174,068
Total . . . . . . . . . . . . . . . . . . . . . . . . . 203,911 419,278 722,551 5,473,871
Music —
Customers . . . . . . . . . . . . . . . . . . . . . . . 506,455 570,119 660,407 5,003,083
Intersegment . . . . . . . . . . . . . . . . . . . . . 11,380 21,961 34,307 259,902
Total . . . . . . . . . . . . . . . . . . . . . . . . . 517,835 592,080 694,714 5,262,985
Pictures —
Customers . . . . . . . . . . . . . . . . . . . . . . . 317,382 438,551 642,714 4,869,046
Intersegment . . . . . . . . . . . . . . . . . . . . . 198 3 450 3,409
Total . . . . . . . . . . . . . . . . . . . . . . . . . 317,580 438,554 643,164 4,872,455
Insurance —
Customers . . . . . . . . . . . . . . . . . . . . . . . 206,802 227,920 291,061 2,205,008
Intersegment . . . . . . . . . . . . . . . . . . . . . 101 14 753
Total . . . . . . . . . . . . . . . . . . . . . . . . . 206,903 227,934 291,068 2,205,061
Other —
Customers . . . . . . . . . . . . . . . . . . . . . . . 77,798 87,917 84,388 639,303
Intersegment . . . . . . . . . . . . . . . . . . . . . 196,177 152,457 163,841 1,241,220
Total . . . . . . . . . . . . . . . . . . . . . . . . . 273,975 240,374 248,229 1,880,523
Elimination . . . . . . . . . . . . . . . . . . . . . . . . (393,095) (386,717) (534,346) (4,048,076)
Consolidated total . . . . . . . . . . . . . . . . . . . . . ¥4,592,565 ¥5,663,134 ¥6,755,490 $51,177,955
Segment profit or loss:
Yen in millions Dollars in thousands
Year ended March 31 Year ended
1996 1997 1998 March 31, 1998
Operating income (loss):
Electronics . . . . . . . . . . . . . . . . . . . . . . . . ¥193,331 ¥239,312 ¥314,538 $2,382,864
Game . . . . . . . . . . . . . . . . . . . . . . . . . . . . (8,938) 57,045 116,936 885,879
Music . . . . . . . . . . . . . . . . . . . . . . . . . . . . 40,129 45,216 54,084 409,727
Pictures . . . . . . . . . . . . . . . . . . . . . . . . . . 23,862 28,925 35,544 269,273
Insurance . . . . . . . . . . . . . . . . . . . . . . . . . 7,116 19,099 20,326 153,985
Other . . . . . . . . . . . . . . . . . . . . . . . . . . . . (6,078) (1,422) (10,292) (77,970)
Total . . . . . . . . . . . . . . . . . . . . . . . . . 249,422 388,175 531,136 4,023,758
Elimination . . . . . . . . . . . . . . . . . . . . . . . . 5,188 3,390 10,749 81,432
Unallocated amounts: Corporate expenses . . . (19,286) (21,235) (21,675) (164,205)
Consolidated operating income . . . . . . . . . . . . 235,324 370,330 520,210 3,940,985
Other income . . . . . . . . . . . . . . . . . . . . . . . . 65,755 92,643 83,963 636,083
Other expenses . . . . . . . . . . . . . . . . . . . . . . . (162,920) (150,544) (150,424) (1,139,576)
Consolidated income before income taxes . . . . . ¥138,159 ¥312,429 ¥453,749 $3,437,492