APC 2011 Annual Report Download - page 10
Download and view the complete annual report
Please find page 10 of the 2011 APC annual report below. You can navigate through the pages in the report by either clicking on the pages listed below, or by using the keyword search tool below to find specific information within the annual report.-
 1
1 -
 2
2 -
 3
3 -
 4
4 -
 5
5 -
 6
6 -
 7
7 -
 8
8 -
 9
9 -
 10
10 -
 11
11 -
 12
12 -
 13
13 -
 14
14 -
 15
15 -
 16
16 -
 17
17 -
 18
18 -
 19
19 -
 20
20 -
 21
21 -
22
-
23
-
24
-
25
-
26
-
27
-
28
-
29
-
30
-
31
-
32
-
33
-
34
-
35
-
36
-
37
-
38
-
39
-
40
-
41
-
42
-
43
-
44
-
45
-
46
-
47
-
48
-
49
-
50
-
51
-
52
-
53
-
54
-
55
-
56
-
57
-
58
-
59
-
60
-
61
-
62
-
63
-
64
-
65
-
66
-
67
-
68
-
69
-
70
-
71
-
72
-
73
-
74
-
75
-
76
-
77
-
78
-
79
-
80
-
81
-
82
-
83
-
84
-
85
-
86
-
87
-
88
-
89
-
90
-
91
-
92
-
93
-
94
-
95
-
96
-
97
-
98
-
99
-
100
-
101
-
102
-
103
-
104
-
105
-
106
-
107
-
108
-
109
-
110
-
111
-
112
-
113
-
114
-
115
-
116
-
117
-
118
-
119
-
120
-
121
-
122
-
123
-
124
-
125
-
126
-
127
-
128
-
129
-
130
-
131
-
132
-
133
-
134
-
135
-
136
-
137
-
138
-
139
-
140
-
141
-
142
-
143
-
144
-
145
-
146
-
147
-
148
-
149
-
150
-
151
-
152
-
153
-
154
-
155
-
156
-
157
-
158
-
159
-
160
-
161
-
162
-
163
-
164
-
165
-
166
-
167
-
168
-
169
-
170
-
171
-
172
-
173
-
174
-
175
-
176
-
177
-
178
-
179
-
180
-
181
-
182
-
183
-
184
-
185
-
186
-
187
-
188
-
189
-
190
-
191
-
192
-
193
-
194
-
195
-
196
-
197
-
198
-
199
-
200
-
201
-
202
-
203
-
204
-
205
-
206
-
207
-
208
-
209
-
210
-
211
-
212
-
213
-
214
-
215
-
216
-
217
-
218
-
219
-
220
-
221
-
222
-
223
-
224
-
225
-
226
-
227
-
228
-
229
-
230
-
231
-
232
-
233
-
234
-
235
-
236
-
237
-
238
-
239
-
240
-
241
-
242
-
243
-
244
-
245
-
246
-
247
-
248
-
249
-
250
-
251
-
252
-
253
-
254
-
255
-
256
-
257
-
258
-
259
-
260
-
261
-
262
-
263
-
264
-
265
-
266
-
267
-
268
-
269
-
270
-
271
-
272
-
273
-
274
-
275
-
276
-
277
-
278
-
279
-
280
 |
 |

82011 REGISTRATION DOCUMENT SCHNEIDER ELECTRIC
KEY FIGURES 2011
>
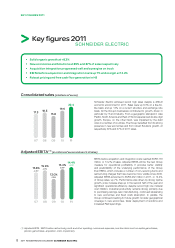
Key figures 2011
SCHNEIDER ELECTRIC
•Solid organic growth at +8.3%
•New economies and Solutions at 39% and 37% of sales respectively
•Acquisition integration progressed well and synergies on track
•EBITA before acquisition and integration costs up 7% and margin at 14.2%
•Robust pricing and free cash flow generation in H2
Consolidated sales (in billions of euros)
07
17.3
11
22.4
08
18.3
09
15.8
10
19.6
Schneider Electric achieved record high sales despite a diffi cult
economic environment in 2011. Sales were up 8.3% on a like-for-
like basis and up 14% on a current structure and exchange rate
basis. All the Group’s businesses contributed to growth, driven in
particular by IT and Industry. From a geographic standpoint, Asia
Pacifi c, North America and Rest of World experienced double digit
growth. Europe, on the other hand, was impacted by the debt
crisis in a number of countries. The Group benefi ted from its strong
presence in new economies and from robust Solutions growth, at
respectively 39% and 37% of 2011 sales.
Adjusted EBITA (1) (in millions of euros and as a % of sales)
(1) Adjusted EBITA : EBITA before restructuring costs and other operating income and expenses (one-time items such as capital gains/losses,
pension gains/losses, acquisition costs, impairment).
15.6%
2,704
15.9%
2,912
13.0%
2,048
15.4%
3,019
14.4%
3,232
07 1108 09 10
EBITA before acquisition and integration costs reached EUR3,178
million , or 14.2% of sales. Adjusted EBITA will be the new Group
measure for operational profi tability. It provides better visibility
and predictability of the underlying performance of the Group
than EBITA, which includes a number of non-recurring items and
restructuring charges that have become more volatile since 2009.
Adjusted EBITA amounted to EUR3,232 million in 2011, or 14.4%
of Group sales, up 7%. Performance was driven by strong topline
growth, price increase step-up in the second half of the year and
signifi cant operational effi ciency, despite record high raw material
cost infl ation. Industrial productivity remains strong primarily due
to purchasing savings, lean manufacturing, continued rebalancing
to new economies and fi xed costs absorption. In parallel, the
Group continued investing for future growth: broader geographical
coverage in new economies, faster deployment of solutions and
increased R&D spendings.