APC 2011 Annual Report Download - page 11
Download and view the complete annual report
Please find page 11 of the 2011 APC annual report below. You can navigate through the pages in the report by either clicking on the pages listed below, or by using the keyword search tool below to find specific information within the annual report.-
 1
1 -
 2
2 -
 3
3 -
 4
4 -
 5
5 -
 6
6 -
 7
7 -
 8
8 -
 9
9 -
 10
10 -
 11
11 -
 12
12 -
 13
13 -
 14
14 -
 15
15 -
 16
16 -
 17
17 -
 18
18 -
 19
19 -
 20
20 -
 21
21 -
 22
22 -
23
-
24
-
25
-
26
-
27
-
28
-
29
-
30
-
31
-
32
-
33
-
34
-
35
-
36
-
37
-
38
-
39
-
40
-
41
-
42
-
43
-
44
-
45
-
46
-
47
-
48
-
49
-
50
-
51
-
52
-
53
-
54
-
55
-
56
-
57
-
58
-
59
-
60
-
61
-
62
-
63
-
64
-
65
-
66
-
67
-
68
-
69
-
70
-
71
-
72
-
73
-
74
-
75
-
76
-
77
-
78
-
79
-
80
-
81
-
82
-
83
-
84
-
85
-
86
-
87
-
88
-
89
-
90
-
91
-
92
-
93
-
94
-
95
-
96
-
97
-
98
-
99
-
100
-
101
-
102
-
103
-
104
-
105
-
106
-
107
-
108
-
109
-
110
-
111
-
112
-
113
-
114
-
115
-
116
-
117
-
118
-
119
-
120
-
121
-
122
-
123
-
124
-
125
-
126
-
127
-
128
-
129
-
130
-
131
-
132
-
133
-
134
-
135
-
136
-
137
-
138
-
139
-
140
-
141
-
142
-
143
-
144
-
145
-
146
-
147
-
148
-
149
-
150
-
151
-
152
-
153
-
154
-
155
-
156
-
157
-
158
-
159
-
160
-
161
-
162
-
163
-
164
-
165
-
166
-
167
-
168
-
169
-
170
-
171
-
172
-
173
-
174
-
175
-
176
-
177
-
178
-
179
-
180
-
181
-
182
-
183
-
184
-
185
-
186
-
187
-
188
-
189
-
190
-
191
-
192
-
193
-
194
-
195
-
196
-
197
-
198
-
199
-
200
-
201
-
202
-
203
-
204
-
205
-
206
-
207
-
208
-
209
-
210
-
211
-
212
-
213
-
214
-
215
-
216
-
217
-
218
-
219
-
220
-
221
-
222
-
223
-
224
-
225
-
226
-
227
-
228
-
229
-
230
-
231
-
232
-
233
-
234
-
235
-
236
-
237
-
238
-
239
-
240
-
241
-
242
-
243
-
244
-
245
-
246
-
247
-
248
-
249
-
250
-
251
-
252
-
253
-
254
-
255
-
256
-
257
-
258
-
259
-
260
-
261
-
262
-
263
-
264
-
265
-
266
-
267
-
268
-
269
-
270
-
271
-
272
-
273
-
274
-
275
-
276
-
277
-
278
-
279
-
280
 |
 |

92011 REGISTRATION DOCUMENT SCHNEIDER ELECTRIC
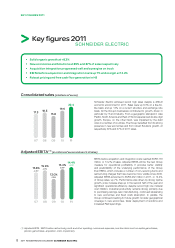
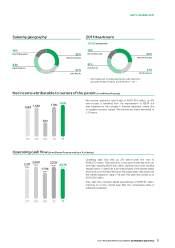
KEY FIGURES 2011
Sales by geography
18%
Rest of the world
23%
North America
32%
Western Europe
27%
Asia-Pacific
2011 Headcount
16%
Rest of the world
31%
Asia-Pacific
32%
Western Europe
21%
North America
* Spot headcount, including employees under fixed-term
and open-ended contracts, at December 31, 2011
137,535 employees*
Net income attributable to owners of the parent (in millions of euros)
07
1,583
11
1,820
08
1,682
09
824
10
1,720
Net income reached a record high of EUR1,820 million , up 6%
year-on-year. It benefi ted from the improvement of EBITA but
was impacted by the increase in fi nancial expenses, mainly due
to negative currency impact. Net income per share amounted to
3.39 euros.
Operating cash flow (in millions of euros and as a % of sales)
07 1108 09 10
2,211
12.8%
2,500
13.7%
1,708
10.8%
2,534
12.9%
2,579
11.5 %
Operating cash fl ow was up 2% year-on-year and rose to
EUR2,579 million . Free cash fl ow in the second half was at an all-
time high, reaching EUR1,665 million , achieved by a strict working
capital control, in particular a full re-absorption of the excess safety
stock built up in the fi rst half due to the supply chain disruption post
the natural disaster in Japan. Full year free cash fl ow ended up at
EUR1,506 million .
Free cash fl ow included capital expenditures of EUR746 million ,
returning to a more normal level after two consecutive years of
subdued investment.