APC 2011 Annual Report Download - page 181
Download and view the complete annual report
Please find page 181 of the 2011 APC annual report below. You can navigate through the pages in the report by either clicking on the pages listed below, or by using the keyword search tool below to find specific information within the annual report.-
 1
1 -
2
-
3
-
4
-
5
-
6
-
7
-
8
-
9
-
10
-
11
-
12
-
13
-
14
-
15
-
16
-
17
-
18
-
19
-
20
-
21
-
22
-
23
-
24
-
25
-
26
-
27
-
28
-
29
-
30
-
31
-
32
-
33
-
34
-
35
-
36
-
37
-
38
-
39
-
40
-
41
-
42
-
43
-
44
-
45
-
46
-
47
-
48
-
49
-
50
-
51
-
52
-
53
-
54
-
55
-
56
-
57
-
58
-
59
-
60
-
61
-
62
-
63
-
64
-
65
-
66
-
67
-
68
-
69
-
70
-
71
-
72
-
73
-
74
-
75
-
76
-
77
-
78
-
79
-
80
-
81
-
82
-
83
-
84
-
85
-
86
-
87
-
88
-
89
-
90
-
91
-
92
-
93
-
94
-
95
-
96
-
97
-
98
-
99
-
100
-
101
-
102
-
103
-
104
-
105
-
106
-
107
-
108
-
109
-
110
-
111
-
112
-
113
-
114
-
115
-
116
-
117
-
118
-
119
-
120
-
121
-
122
-
123
-
124
-
125
-
126
-
127
-
128
-
129
-
130
-
131
-
132
-
133
-
134
-
135
-
136
-
137
-
138
-
139
-
140
-
141
-
142
-
143
-
144
-
145
-
146
-
147
-
148
-
149
-
150
-
151
-
152
-
153
-
154
-
155
-
156
-
157
-
158
-
159
-
160
-
161
-
162
-
163
-
164
-
165
-
166
-
167
-
168
-
169
-
170
-
 171
171 -
 172
172 -
 173
173 -
 174
174 -
 175
175 -
 176
176 -
 177
177 -
 178
178 -
 179
179 -
 180
180 -
 181
181 -
 182
182 -
 183
183 -
 184
184 -
 185
185 -
 186
186 -
 187
187 -
 188
188 -
 189
189 -
 190
190 -
 191
191 -
192
-
193
-
194
-
195
-
196
-
197
-
198
-
199
-
200
-
201
-
202
-
203
-
204
-
205
-
206
-
207
-
208
-
209
-
210
-
211
-
212
-
213
-
214
-
215
-
216
-
217
-
218
-
219
-
220
-
221
-
222
-
223
-
224
-
225
-
226
-
227
-
228
-
229
-
230
-
231
-
232
-
233
-
234
-
235
-
236
-
237
-
238
-
239
-
240
-
241
-
242
-
243
-
244
-
245
-
246
-
247
-
248
-
249
-
250
-
251
-
252
-
253
-
254
-
255
-
256
-
257
-
258
-
259
-
260
-
261
-
262
-
263
-
264
-
265
-
266
-
267
-
268
-
269
-
270
-
271
-
272
-
273
-
274
-
275
-
276
-
277
-
278
-
279
-
280
 |
 |

1792011 REGISTRATION DOCUMENT SCHNEIDER ELECTRIC
CONSOLIDATED FINANCIAL STATEMENTS
5
NOTES TO THE CONSOLIDATED FINANCIAL STATEMENTS
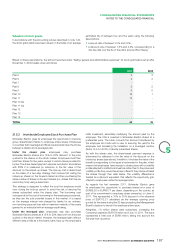
Note14
Investments in associates
Investments in associates can be analysed as follows:
% interest at Dec.31 Share net assets at Dec.31 Share in net profi t at Dec.31
2011 2010 2011 2010 2011 2010
Delta Dore Finance 20.0% 20.0% 15 13 2 1
Electroshield TM Samara 50.0% 50.0% 276 266 14 -
Sunten Electric Equipment 50.0% 50.0% 96 85 - (1)
Fuji Electric FA Components & Systems 36.8% 36.8% 96 76 12 5
Other N/A N/A 6 7 - 1
TOTAL - - 489 447 28 6
Note15
Financial assets
15.1 – Available-for-sale financial assets
Available-for-sale fi nancial assets, primarily comprising investments, are detailed below:
Dec.31, 2011 Dec.31, 2010
% interest Gross value Revaluation/
impairment Fair value Fair value
I – Listed available-for-sale fi nancial assets
AXA 0.5% 111 (4) 107 132
NVC Ligthing 9.2% 115 (33) 82 -
Gold Peak Industries Holding Ltd 4.4% 6 (4) 2 3
Total listed AFS 232 (41) 191 135
II – Unlisted available-for-sale fi nancial assets
Citec, SEAT (1) 100.0% 6 - 6 -
FCPR SEV1 100.0% 34 21 55 58
FCPR SESS 54.5% 10 - 10 10
Simak (2) 99.4% 5 - 5 5
SE Venture 100.0% 7 (7) - -
Others (3) 36 (7) 29 202
Total unlisted AFS 98 7 105 275
TOTAL AVAILABLE-FOR-SALE FINANCIAL
ASSETS 330 (34) 296 410
(1) Companies purchased in 2011.
(2) Removed from the scope of consolidation – in liquidation.
(3) Gross unit value of less than EUR5million.
The fair value of investments quoted in an active market corresponds
to the price on the balance sheet date. The revaluation of listed
investments over the year has had a negative impact on other
equity reserves of EUR60million.
15.2 – Other non-current financial assets
Non Current fi nancial assets total EUR261million at December31,
2011 and include potential assets linked to acquisitions.
15.3 – Current financial assets
Current fi nancial assets total EUR104million at December31, 2011
and comprise short-term investments.