APC 2011 Annual Report Download - page 258
Download and view the complete annual report
Please find page 258 of the 2011 APC annual report below. You can navigate through the pages in the report by either clicking on the pages listed below, or by using the keyword search tool below to find specific information within the annual report.-
 1
1 -
2
-
3
-
4
-
5
-
6
-
7
-
8
-
9
-
10
-
11
-
12
-
13
-
14
-
15
-
16
-
17
-
18
-
19
-
20
-
21
-
22
-
23
-
24
-
25
-
26
-
27
-
28
-
29
-
30
-
31
-
32
-
33
-
34
-
35
-
36
-
37
-
38
-
39
-
40
-
41
-
42
-
43
-
44
-
45
-
46
-
47
-
48
-
49
-
50
-
51
-
52
-
53
-
54
-
55
-
56
-
57
-
58
-
59
-
60
-
61
-
62
-
63
-
64
-
65
-
66
-
67
-
68
-
69
-
70
-
71
-
72
-
73
-
74
-
75
-
76
-
77
-
78
-
79
-
80
-
81
-
82
-
83
-
84
-
85
-
86
-
87
-
88
-
89
-
90
-
91
-
92
-
93
-
94
-
95
-
96
-
97
-
98
-
99
-
100
-
101
-
102
-
103
-
104
-
105
-
106
-
107
-
108
-
109
-
110
-
111
-
112
-
113
-
114
-
115
-
116
-
117
-
118
-
119
-
120
-
121
-
122
-
123
-
124
-
125
-
126
-
127
-
128
-
129
-
130
-
131
-
132
-
133
-
134
-
135
-
136
-
137
-
138
-
139
-
140
-
141
-
142
-
143
-
144
-
145
-
146
-
147
-
148
-
149
-
150
-
151
-
152
-
153
-
154
-
155
-
156
-
157
-
158
-
159
-
160
-
161
-
162
-
163
-
164
-
165
-
166
-
167
-
168
-
169
-
170
-
171
-
172
-
173
-
174
-
175
-
176
-
177
-
178
-
179
-
180
-
181
-
182
-
183
-
184
-
185
-
186
-
187
-
188
-
189
-
190
-
191
-
192
-
193
-
194
-
195
-
196
-
197
-
198
-
199
-
200
-
201
-
202
-
203
-
204
-
205
-
206
-
207
-
208
-
209
-
210
-
211
-
212
-
213
-
214
-
215
-
216
-
217
-
218
-
219
-
220
-
221
-
222
-
223
-
224
-
225
-
226
-
227
-
228
-
229
-
230
-
231
-
232
-
233
-
234
-
235
-
236
-
237
-
238
-
239
-
240
-
241
-
242
-
243
-
244
-
245
-
246
-
247
-
 248
248 -
 249
249 -
 250
250 -
 251
251 -
 252
252 -
 253
253 -
 254
254 -
 255
255 -
 256
256 -
 257
257 -
 258
258 -
 259
259 -
 260
260 -
 261
261 -
 262
262 -
 263
263 -
 264
264 -
 265
265 -
 266
266 -
 267
267 -
 268
268 -
269
-
270
-
271
-
272
-
273
-
274
-
275
-
276
-
277
-
278
-
279
-
280
 |
 |

256 2011 REGISTRATION DOCUMENT SCHNEIDER ELECTRIC
GENERAL PRESENTATION OF SCHNEIDERELECTRICSA
7STOCK MARKET DATA
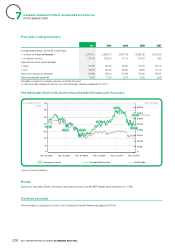
Five-year trading summary
2011 2010 2009 2008 2007
Average daily trading volume Euronext Paris:
• number of shares (in thousands) (1) 2,316.01 2,642.57 2,647.16 3,382.38 3,175.58
• inmillions of euros 115.78 108.23 77.12 115.18 152
High and low share prices (ineuros):
• high(1) 61.83 60.00 40.93 47.15 55.13
• low(1) 35.00 36.00 20.65 19.42 41.76
Year-end closing price (ineuros) (1) 40.68 56.00 40.89 26.50 46.34
Yield including tax credit(%) 4.18 2.86 2.51 6.50 3.56
The data correspond to trading volumes on NYSE Euronext.
(1) Historical data restated for the two-for-one share split, effective September2, 2011.
The Schneider ElectricSA share versus the CAC40 index over five years
0
1,000
2,000
3,000
4,000
5,000
6,000
7,000
8,000
Dec. 31, 2010Dec. 31, 2008Dec. 31, 2007Dec. 31, 2006 Dec. 31, 2011
31/01/2012
Dec. 31, 2009
Share price in euros Schneider Electric share CAC 40 index
40.68
47.48
46.34 26.50
40.89
56.00
0
10
20
30
40
50
60
70
Schneider Electric
share CAC 40 index
42.05
(Source: Thomson Reuters )
Monep
Options on Schneider Electric SA shares have been traded on the MONEP market since December20, 1996.
Ordinary bonds
The information is disclosed in note 9 of the Company Financial Statements (pages229-230).