APC 2011 Annual Report Download - page 102
Download and view the complete annual report
Please find page 102 of the 2011 APC annual report below. You can navigate through the pages in the report by either clicking on the pages listed below, or by using the keyword search tool below to find specific information within the annual report.-
 1
1 -
2
-
3
-
4
-
5
-
6
-
7
-
8
-
9
-
10
-
11
-
12
-
13
-
14
-
15
-
16
-
17
-
18
-
19
-
20
-
21
-
22
-
23
-
24
-
25
-
26
-
27
-
28
-
29
-
30
-
31
-
32
-
33
-
34
-
35
-
36
-
37
-
38
-
39
-
40
-
41
-
42
-
43
-
44
-
45
-
46
-
47
-
48
-
49
-
50
-
51
-
52
-
53
-
54
-
55
-
56
-
57
-
58
-
59
-
60
-
61
-
62
-
63
-
64
-
65
-
66
-
67
-
68
-
69
-
70
-
71
-
72
-
73
-
74
-
75
-
76
-
77
-
78
-
79
-
80
-
81
-
82
-
83
-
84
-
85
-
86
-
87
-
88
-
89
-
90
-
91
-
 92
92 -
 93
93 -
 94
94 -
 95
95 -
 96
96 -
 97
97 -
 98
98 -
 99
99 -
 100
100 -
 101
101 -
 102
102 -
 103
103 -
 104
104 -
 105
105 -
 106
106 -
 107
107 -
 108
108 -
 109
109 -
 110
110 -
 111
111 -
 112
112 -
113
-
114
-
115
-
116
-
117
-
118
-
119
-
120
-
121
-
122
-
123
-
124
-
125
-
126
-
127
-
128
-
129
-
130
-
131
-
132
-
133
-
134
-
135
-
136
-
137
-
138
-
139
-
140
-
141
-
142
-
143
-
144
-
145
-
146
-
147
-
148
-
149
-
150
-
151
-
152
-
153
-
154
-
155
-
156
-
157
-
158
-
159
-
160
-
161
-
162
-
163
-
164
-
165
-
166
-
167
-
168
-
169
-
170
-
171
-
172
-
173
-
174
-
175
-
176
-
177
-
178
-
179
-
180
-
181
-
182
-
183
-
184
-
185
-
186
-
187
-
188
-
189
-
190
-
191
-
192
-
193
-
194
-
195
-
196
-
197
-
198
-
199
-
200
-
201
-
202
-
203
-
204
-
205
-
206
-
207
-
208
-
209
-
210
-
211
-
212
-
213
-
214
-
215
-
216
-
217
-
218
-
219
-
220
-
221
-
222
-
223
-
224
-
225
-
226
-
227
-
228
-
229
-
230
-
231
-
232
-
233
-
234
-
235
-
236
-
237
-
238
-
239
-
240
-
241
-
242
-
243
-
244
-
245
-
246
-
247
-
248
-
249
-
250
-
251
-
252
-
253
-
254
-
255
-
256
-
257
-
258
-
259
-
260
-
261
-
262
-
263
-
264
-
265
-
266
-
267
-
268
-
269
-
270
-
271
-
272
-
273
-
274
-
275
-
276
-
277
-
278
-
279
-
280
 |
 |

REGISTRATION DOCUMENT 2011 SCHNEIDER ELECTRIC100
SUSTAINABLE DEVELOPMENT
2INDICATORS
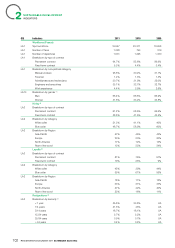
7.2 Social indicators
The indicators below have a Group scope. They cover 100% of
the workforce from integrated companies (see rules page 90 ).
Certain indicators cover 80% of workforce; they are indicated by the
footnotes at the bottom of the page. To respond to the French NRE,
some indicators are given for France only. The precisions on the
variations of scope are contributed at the end of the tables below
and indicated by footer notes.
The social indicators count the people with fi xed-term contracts, on
work-experience and on permanent contracts. The indicators that
also include temporary workers and/or subcontractors on site are
indicated by footer notes.
The comments on the indicators are given in the matching chapters
and indicated in the tables below.
The table below indicates the matching of indicators with the Global
Reporting Initiative.
Workforce
GRI Indicators 2011 2010 2009
Workforce
LA1 Average workforce(4) 140,489 123,482 116,065
Of which production(4) 70,609 61,913 55,125
Of which structure(4) 69,580 61,569 60,940
LA1 Average supplementary workforce 13,924 ▲12,049 8,463
LA1 Fixed-term contract and permanent contract personnel(5) 137,535 ▲118,819 104,853
Of which permanent contract 87.4% 88.4% UA
Of which fi xed-term contract 12.7% 11.6% UA
LA1
Share of temporary personnel (supplementary and fi xed-term
contracts)(5) 20.5% 20.8% 18.9%
LA1 Organisation of working time(3)
Full-time 97.9% NP NP
Part-time 2.1% NP NP
LA1 Hiring(6) 19,792 ▲17,590 8,977
LA1 Departures(6) 16,362 14,968 17,663
Of which layoffs 3,887 ▲3,976 6,331
Of which resignations 7,558 NP NP
Others (retirement, end of contract, etc.) 4,917 NP NP
LA1 Voluntary turnover 6% ▲7% 5%
LA1 Breakdown of workforce by region(5)
Asia-Pacifi c 31% 27% 25%
Europe 39% 42% 43%
North America 21% 22% 24%
Rest of the world 9% 9% 8%
LA1
Breakdown of workforce by country
(themostsignifi cantcountries)(5)
France 13% 17% 18%
United States of America 12% 15% 17%
China 10% 10% 10%
India 8% 6% 5%
Mexico 5% 6% 6%
Spain 4% 3% 3%
Germany 3% 4% 3%
Brazil 3% 3% 2%
Australia 3% 3% 3%