APC 2011 Annual Report Download - page 103
Download and view the complete annual report
Please find page 103 of the 2011 APC annual report below. You can navigate through the pages in the report by either clicking on the pages listed below, or by using the keyword search tool below to find specific information within the annual report.-
 1
1 -
2
-
3
-
4
-
5
-
6
-
7
-
8
-
9
-
10
-
11
-
12
-
13
-
14
-
15
-
16
-
17
-
18
-
19
-
20
-
21
-
22
-
23
-
24
-
25
-
26
-
27
-
28
-
29
-
30
-
31
-
32
-
33
-
34
-
35
-
36
-
37
-
38
-
39
-
40
-
41
-
42
-
43
-
44
-
45
-
46
-
47
-
48
-
49
-
50
-
51
-
52
-
53
-
54
-
55
-
56
-
57
-
58
-
59
-
60
-
61
-
62
-
63
-
64
-
65
-
66
-
67
-
68
-
69
-
70
-
71
-
72
-
73
-
74
-
75
-
76
-
77
-
78
-
79
-
80
-
81
-
82
-
83
-
84
-
85
-
86
-
87
-
88
-
89
-
90
-
91
-
92
-
 93
93 -
 94
94 -
 95
95 -
 96
96 -
 97
97 -
 98
98 -
 99
99 -
 100
100 -
 101
101 -
 102
102 -
 103
103 -
 104
104 -
 105
105 -
 106
106 -
 107
107 -
 108
108 -
 109
109 -
 110
110 -
 111
111 -
 112
112 -
 113
113 -
114
-
115
-
116
-
117
-
118
-
119
-
120
-
121
-
122
-
123
-
124
-
125
-
126
-
127
-
128
-
129
-
130
-
131
-
132
-
133
-
134
-
135
-
136
-
137
-
138
-
139
-
140
-
141
-
142
-
143
-
144
-
145
-
146
-
147
-
148
-
149
-
150
-
151
-
152
-
153
-
154
-
155
-
156
-
157
-
158
-
159
-
160
-
161
-
162
-
163
-
164
-
165
-
166
-
167
-
168
-
169
-
170
-
171
-
172
-
173
-
174
-
175
-
176
-
177
-
178
-
179
-
180
-
181
-
182
-
183
-
184
-
185
-
186
-
187
-
188
-
189
-
190
-
191
-
192
-
193
-
194
-
195
-
196
-
197
-
198
-
199
-
200
-
201
-
202
-
203
-
204
-
205
-
206
-
207
-
208
-
209
-
210
-
211
-
212
-
213
-
214
-
215
-
216
-
217
-
218
-
219
-
220
-
221
-
222
-
223
-
224
-
225
-
226
-
227
-
228
-
229
-
230
-
231
-
232
-
233
-
234
-
235
-
236
-
237
-
238
-
239
-
240
-
241
-
242
-
243
-
244
-
245
-
246
-
247
-
248
-
249
-
250
-
251
-
252
-
253
-
254
-
255
-
256
-
257
-
258
-
259
-
260
-
261
-
262
-
263
-
264
-
265
-
266
-
267
-
268
-
269
-
270
-
271
-
272
-
273
-
274
-
275
-
276
-
277
-
278
-
279
-
280
 |
 |

REGISTRATION DOCUMENT 2011 SCHNEIDER ELECTRIC 101
SUSTAINABLE DEVELOPMENT
2
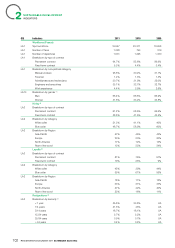
INDICATORS
GRI Indicators 2011 2010 2009
Indonesia 2% NP NP
United Kingdom 2% 3% 3%
Russia 2% 3% 3%
LA1
Annual change in workforce by country (the most signifi cant
countries)(5)
France - 2% +9% -6%
United States of America + 9% - 1% -10%
China + 29% +24% -9%
India + 88% + 38% + 2%
Mexico + 5% +14% - 16%
Spain + 74% +6% -20%
Germany + 2% +57% -8%
Brazil + 38% +40% + 16%
Australia + 22% +2% -13%
United Kingdom + 8% +11% -11%
Russia - 1% +6% - 20%
LA13 Breakdown of workforce by gender(2)
Men 68% ▲66% 66%
Women 32% ▲34% 34%
LA13 Breakdown of workforce by gender and by category(2)
White collar 54.5% 53.6% 54.6%
Men 72% 71% 72%
Women 28% 29% 28%
Blue collar 45.5% 46.4% 45.4%
Men** 64% 60% 60%
Women 36% 40% 40%
LA13 Breakdown of workforce by age(2)
14/24years 9.7% 8.7% 7.9%
25/34years 32.7% 31.4% 30.7%
35/44years 36.4% 27.5% 27.9%
45/54years 21.2% 22.3% 23.3%
55/64years 9.6% 9.7% 9.8%
> 64years 0.4% 0.4% 0.5%
LA1 Breakdown of workforce by seniority(2)
< 5years 44.2% 43.9% 44.7%
5/14years 29.9% 30.4% 29.2%
15/24years 13.8% 13.7% 13.9%
25/34years 8.8% 8.6% 9%
> 34years 3.3% 3.4% 3.2%
LA1 Breakdown of workforce by function
Marketing 3.8% 3.8% 3.9%
Sales 12% 14.9% 17.2%
Services and projects** 15% 12.9% 9.5%
Support 19.2% 16.8% 16.3%
Technical 8.4% 7.6% 7.2%
Industrial 6.4% 6.6% 7.6%
LA1
Direct variable costs* (cost of employees under production or
business costs) 45.4% 46.4% 45.4%