APC 2011 Annual Report Download - page 100
Download and view the complete annual report
Please find page 100 of the 2011 APC annual report below. You can navigate through the pages in the report by either clicking on the pages listed below, or by using the keyword search tool below to find specific information within the annual report.-
 1
1 -
2
-
3
-
4
-
5
-
6
-
7
-
8
-
9
-
10
-
11
-
12
-
13
-
14
-
15
-
16
-
17
-
18
-
19
-
20
-
21
-
22
-
23
-
24
-
25
-
26
-
27
-
28
-
29
-
30
-
31
-
32
-
33
-
34
-
35
-
36
-
37
-
38
-
39
-
40
-
41
-
42
-
43
-
44
-
45
-
46
-
47
-
48
-
49
-
50
-
51
-
52
-
53
-
54
-
55
-
56
-
57
-
58
-
59
-
60
-
61
-
62
-
63
-
64
-
65
-
66
-
67
-
68
-
69
-
70
-
71
-
72
-
73
-
74
-
75
-
76
-
77
-
78
-
79
-
80
-
81
-
82
-
83
-
84
-
85
-
86
-
87
-
88
-
89
-
 90
90 -
 91
91 -
 92
92 -
 93
93 -
 94
94 -
 95
95 -
 96
96 -
 97
97 -
 98
98 -
 99
99 -
 100
100 -
 101
101 -
 102
102 -
 103
103 -
 104
104 -
 105
105 -
 106
106 -
 107
107 -
 108
108 -
 109
109 -
 110
110 -
111
-
112
-
113
-
114
-
115
-
116
-
117
-
118
-
119
-
120
-
121
-
122
-
123
-
124
-
125
-
126
-
127
-
128
-
129
-
130
-
131
-
132
-
133
-
134
-
135
-
136
-
137
-
138
-
139
-
140
-
141
-
142
-
143
-
144
-
145
-
146
-
147
-
148
-
149
-
150
-
151
-
152
-
153
-
154
-
155
-
156
-
157
-
158
-
159
-
160
-
161
-
162
-
163
-
164
-
165
-
166
-
167
-
168
-
169
-
170
-
171
-
172
-
173
-
174
-
175
-
176
-
177
-
178
-
179
-
180
-
181
-
182
-
183
-
184
-
185
-
186
-
187
-
188
-
189
-
190
-
191
-
192
-
193
-
194
-
195
-
196
-
197
-
198
-
199
-
200
-
201
-
202
-
203
-
204
-
205
-
206
-
207
-
208
-
209
-
210
-
211
-
212
-
213
-
214
-
215
-
216
-
217
-
218
-
219
-
220
-
221
-
222
-
223
-
224
-
225
-
226
-
227
-
228
-
229
-
230
-
231
-
232
-
233
-
234
-
235
-
236
-
237
-
238
-
239
-
240
-
241
-
242
-
243
-
244
-
245
-
246
-
247
-
248
-
249
-
250
-
251
-
252
-
253
-
254
-
255
-
256
-
257
-
258
-
259
-
260
-
261
-
262
-
263
-
264
-
265
-
266
-
267
-
268
-
269
-
270
-
271
-
272
-
273
-
274
-
275
-
276
-
277
-
278
-
279
-
280
 |
 |

REGISTRATION DOCUMENT 2011 SCHNEIDER ELECTRIC98
SUSTAINABLE DEVELOPMENT
2INDICATORS
>
7. Indicators
7.1 Environmental indicators
The indicators hereafter have a Group scope. They illustrate our
industrial and logistics sites’ environmental consumption, emission,
and waste in addition to certain major tertiary sites.
Schneider Electric provides readers two pieces of information so
that environmental performance can be compared from one year
to another :
•one part publishing constant scope indicators;
•and another part publishing indicators per employee to correct the
changes in the company’s activities. The sites’ workforce includes
Schneider Electric employees (Fixed-term, Permanent, Work-
study participants), temporary staff, and on-site subcontractors.
The table below indicates how the indicators correspond with the
Global Reporting Initiative.
Comments on the indicators are included in the corresponding
chapters .
ISO 14001 certification of sites
2011 2010 2009
Number of ISO 14001 Certifi ed Sites 273 ▲ 251 244
Industrial and Logistics sites 253 236 233
Tertiary Sites 20 15 11
New Sites Certifi ed this Year 36 22 25
Certifi ed Sites that have Closed or Consolidated this Year 14 15 8
▲ 2011 Audited Indicator.
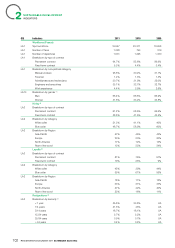
Group sites consumption, emissions, and waste
GRI Indicators
Current Scope Constant Scope
2011 2010 2009 2011 2010
Number of Participating Sites 281 ▲ 255 240 244 244
Number of Employees 102,991 ▲ 87,371 78,078 90,257 86,045
EN22 Amount of Waste Produced (in metric tonnes) 135,392 ▲ 113,684 101,535 118,427 118,001
EN22
Waste Produced per Employee (in metric
tonnes/p) 1.3 ▲ 1.3 1.3 1.3 1.4
EN22 Recovered Waste (in metric tonnes) 112,611 ▲ 95,092 80,255 99,561 96,836
EN22 Percentage of Waste Recovered 83% ▲ 84% 79% 84% 82%
EN8 Water Consumption (m3) 2,863,934 ▲ 2,664,824 2,493,351 2,603,318 2,659,468
EN8 Water Consumption/employee (m3/p) 27.8 ▲ 30.5 31.9 28.8 30.9
EN19-20 VOC Emissions (in kg) (estimates) 451,154 ▲ 461,499 409,219 441,467 530,170
EN19-20
VOC Emissions per Employee (kg/p)
(estimates) 4.4 ▲ 5.3 5.2 4.6 6.2
EN3 Energy Consumption (MWh equivalent) 1,204,580 ▲ 1,186,864 1,066,173 1,116,270 1,178,478
EN4 Electricity (indirect consumption) 839,991 790,829 711,815 UP UP
EN4 Heating (indirect consumption) 31,074 32,231 27,899 UP UP
EN3 Fuel Oil (direct consumption) 21,366 28,128 28,926 UP UP
EN3 Gas (direct consumption) 307,705 331,010 292,917 UP UP