APC 2011 Annual Report Download - page 152
Download and view the complete annual report
Please find page 152 of the 2011 APC annual report below. You can navigate through the pages in the report by either clicking on the pages listed below, or by using the keyword search tool below to find specific information within the annual report.-
 1
1 -
2
-
3
-
4
-
5
-
6
-
7
-
8
-
9
-
10
-
11
-
12
-
13
-
14
-
15
-
16
-
17
-
18
-
19
-
20
-
21
-
22
-
23
-
24
-
25
-
26
-
27
-
28
-
29
-
30
-
31
-
32
-
33
-
34
-
35
-
36
-
37
-
38
-
39
-
40
-
41
-
42
-
43
-
44
-
45
-
46
-
47
-
48
-
49
-
50
-
51
-
52
-
53
-
54
-
55
-
56
-
57
-
58
-
59
-
60
-
61
-
62
-
63
-
64
-
65
-
66
-
67
-
68
-
69
-
70
-
71
-
72
-
73
-
74
-
75
-
76
-
77
-
78
-
79
-
80
-
81
-
82
-
83
-
84
-
85
-
86
-
87
-
88
-
89
-
90
-
91
-
92
-
93
-
94
-
95
-
96
-
97
-
98
-
99
-
100
-
101
-
102
-
103
-
104
-
105
-
106
-
107
-
108
-
109
-
110
-
111
-
112
-
113
-
114
-
115
-
116
-
117
-
118
-
119
-
120
-
121
-
122
-
123
-
124
-
125
-
126
-
127
-
128
-
129
-
130
-
131
-
132
-
133
-
134
-
135
-
136
-
137
-
138
-
139
-
140
-
141
-
 142
142 -
 143
143 -
 144
144 -
 145
145 -
 146
146 -
 147
147 -
 148
148 -
 149
149 -
 150
150 -
 151
151 -
 152
152 -
 153
153 -
 154
154 -
 155
155 -
 156
156 -
 157
157 -
 158
158 -
 159
159 -
 160
160 -
 161
161 -
 162
162 -
163
-
164
-
165
-
166
-
167
-
168
-
169
-
170
-
171
-
172
-
173
-
174
-
175
-
176
-
177
-
178
-
179
-
180
-
181
-
182
-
183
-
184
-
185
-
186
-
187
-
188
-
189
-
190
-
191
-
192
-
193
-
194
-
195
-
196
-
197
-
198
-
199
-
200
-
201
-
202
-
203
-
204
-
205
-
206
-
207
-
208
-
209
-
210
-
211
-
212
-
213
-
214
-
215
-
216
-
217
-
218
-
219
-
220
-
221
-
222
-
223
-
224
-
225
-
226
-
227
-
228
-
229
-
230
-
231
-
232
-
233
-
234
-
235
-
236
-
237
-
238
-
239
-
240
-
241
-
242
-
243
-
244
-
245
-
246
-
247
-
248
-
249
-
250
-
251
-
252
-
253
-
254
-
255
-
256
-
257
-
258
-
259
-
260
-
261
-
262
-
263
-
264
-
265
-
266
-
267
-
268
-
269
-
270
-
271
-
272
-
273
-
274
-
275
-
276
-
277
-
278
-
279
-
280
 |
 |

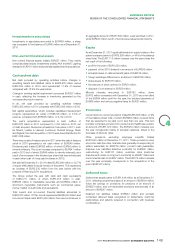
150 2011 REGISTRATION DOCUMENT SCHNEIDER ELECTRIC
BUSINESS REVIEW
4REVIEW OF THE PARENT COMPANY FINANCIAL STATEMENTS
>
3. Review of the parent company
financial statements
>
4. Review of subsidiaries
Schneider Electric SA posted total portfolio revenues of
EUR1,436 million in 2011 compared with EUR691 million the
previous year. Schneider Electric Industries SAS, the main
subsidiary, paid dividends of EUR1,300million in 2011 compared
with EUR672 million in 2010. Interest expense net of interest
income amounted to EUR80 million versus EUR177 million the
year before. Non-recurring income amounted to EUR1,336million
versus EUR497million in 2010.
On December30, 2011, Schneider ElectricSA invoiced Schneider
Electric IndustriesSAS a fi nancial compensation for the use of the
trademark Schneider Electric for EUR1.2billion.
Net profi t stood at EUR2,604million compared with EUR703million
in 2010.
Equity before appropriation of net profi t amounted to
EUR11,701million at December31, 2011 versus EUR9,738million
at the previous year-end, after taking into account 2011 profi t,
dividend payments of EUR856 million and share issues in an
amount of EUR215million.
All trade payables are due before end-January.
Schneider ElectricSA proceed to several bond issuances during
the year for a total nominal amount of EUR1.7 billion euros and
repaid the 2006 bond of EUR500 million at the maturity date
(July18, 2011).
Schneider Electric IndustriesSAS
Revenue totaled EUR3.6billion versus EUR3.4billion in 2010.
The subsidiary posted an operating loss of EUR88million compared
with an operating profi t of EUR22million in 2010.
Net profi t came to EUR992million compared with EUR1,502million
in 2010.
Cofibel
Cofi bel posted a net profi t of EUR2 million, compared with
EUR154million in 2010 (out of which EUR152million of capital gain
on sale of Schneider ElectricSA shares).
Cofimines
Cofi mines posted a net profi t of EUR16 million, compared with
EUR34million in 2010 (out of which EUR29million of capital gain
on sale of Schneider ElectricSA shares).
Remuneration and benefits of corporate officers
The remuneration and other benefi ts paid to corporate offi cers are disclosed in Chapter 3, “Corporate Governance”, paragraph 8,
“Management interests and compensation” (page124 and following).
>
5. Outlook
For 2012, the uncertainty surrounding the global economy limits
visibility. While the Group sees continued strength in new economies
and opportunities from a recovering North America, Western
Europe is expected to weigh on growth.
In this context and assuming no major change in economic
conditions, the Group expects fl at to slightly positive organic growth
for sales and an adjusted EBITA margin between 14% and 15%.