APC 2011 Annual Report Download - page 257
Download and view the complete annual report
Please find page 257 of the 2011 APC annual report below. You can navigate through the pages in the report by either clicking on the pages listed below, or by using the keyword search tool below to find specific information within the annual report.-
 1
1 -
2
-
3
-
4
-
5
-
6
-
7
-
8
-
9
-
10
-
11
-
12
-
13
-
14
-
15
-
16
-
17
-
18
-
19
-
20
-
21
-
22
-
23
-
24
-
25
-
26
-
27
-
28
-
29
-
30
-
31
-
32
-
33
-
34
-
35
-
36
-
37
-
38
-
39
-
40
-
41
-
42
-
43
-
44
-
45
-
46
-
47
-
48
-
49
-
50
-
51
-
52
-
53
-
54
-
55
-
56
-
57
-
58
-
59
-
60
-
61
-
62
-
63
-
64
-
65
-
66
-
67
-
68
-
69
-
70
-
71
-
72
-
73
-
74
-
75
-
76
-
77
-
78
-
79
-
80
-
81
-
82
-
83
-
84
-
85
-
86
-
87
-
88
-
89
-
90
-
91
-
92
-
93
-
94
-
95
-
96
-
97
-
98
-
99
-
100
-
101
-
102
-
103
-
104
-
105
-
106
-
107
-
108
-
109
-
110
-
111
-
112
-
113
-
114
-
115
-
116
-
117
-
118
-
119
-
120
-
121
-
122
-
123
-
124
-
125
-
126
-
127
-
128
-
129
-
130
-
131
-
132
-
133
-
134
-
135
-
136
-
137
-
138
-
139
-
140
-
141
-
142
-
143
-
144
-
145
-
146
-
147
-
148
-
149
-
150
-
151
-
152
-
153
-
154
-
155
-
156
-
157
-
158
-
159
-
160
-
161
-
162
-
163
-
164
-
165
-
166
-
167
-
168
-
169
-
170
-
171
-
172
-
173
-
174
-
175
-
176
-
177
-
178
-
179
-
180
-
181
-
182
-
183
-
184
-
185
-
186
-
187
-
188
-
189
-
190
-
191
-
192
-
193
-
194
-
195
-
196
-
197
-
198
-
199
-
200
-
201
-
202
-
203
-
204
-
205
-
206
-
207
-
208
-
209
-
210
-
211
-
212
-
213
-
214
-
215
-
216
-
217
-
218
-
219
-
220
-
221
-
222
-
223
-
224
-
225
-
226
-
227
-
228
-
229
-
230
-
231
-
232
-
233
-
234
-
235
-
236
-
237
-
238
-
239
-
240
-
241
-
242
-
243
-
244
-
245
-
246
-
 247
247 -
 248
248 -
 249
249 -
 250
250 -
 251
251 -
 252
252 -
 253
253 -
 254
254 -
 255
255 -
 256
256 -
 257
257 -
 258
258 -
 259
259 -
 260
260 -
 261
261 -
 262
262 -
 263
263 -
 264
264 -
 265
265 -
 266
266 -
 267
267 -
268
-
269
-
270
-
271
-
272
-
273
-
274
-
275
-
276
-
277
-
278
-
279
-
280
 |
 |

2552011 REGISTRATION DOCUMENT SCHNEIDER ELECTRIC
GENERAL PRESENTATION OF SCHNEIDERELECTRICSA
7
STOCK MARKET DATA
>
7.
Disclosure of information required in
accordance with articleL.225- 100-3
oftheFrench Commercial Code**
Items that could have an impact in the event of a public tender
offerinclude:
•agreements calling for payments to the members of the
Management Board or to employees if they resign or are
terminated without real cause or if their employment ends due to
a public tender offer (see page130 );
•agreements entered into by the Company with change of
control clauses: information on the exercise of stock options
and performance shares grants (see page2 49 ); information on
certain loans and credit facilities (see page38 );
•restrictions in the articles of association on the exercise of voting
rights (see page2 49 ) relating to the non-application of the ceiling
on voting rights when a public tender offer is in process.
>
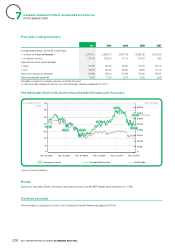
8. Stock market data
In France, Schneider Electric is listed on the Eurolist of the Euronext Paris market (compartment A), where it is traded in lots of one under
ISIN code FR0000121972. It is part of the market’s benchmark CAC40 index of France’s largest stocks.
18-month trading data in Paris
Year Month Trading volume (1)
(inthousands)
Capital traded
(inmillions of euros)
Highs and lows(1)(2) (in euros) Number of trading
sessionsHigh Low
2010 August 45,370 1,989 46.73 40.70 22
September 51,863 2,338 47.48 40.80 22
October 51,429 2,535 51.93 45.71 21
November 35,675 1,899 56.88 50.43 22
December 33,968 1,911 60.00 54.65 23
2011 January 35,086 2,008 59.68 54.18 21
February 35,259 2,019 60.25 54.48 20
March 51,517 2,976 61.65 52.90 23
April 44,356 2,566 61.83 54.00 19
May 65,613 3,790 60.28 54.10 22
June 39,550 2,201 58.00 53.73 22
July 43,348 2,319 58.85 47.00 21
August 78,375 3,554 52.13 40.59 23
September 63,191 2,626 47.40 35.94 22
October 50,244 2,160 47.60 37.48 21
November 50,276 1,982 43.19 35.00 22
December 38,399 1,553 43.12 37.01 21
TOTAL 2011 595,214 29,755 257
2012 January 44,997 2,066 49.77 40.31 22
The data correspond to trading volumes on NYSE Euronext.
(1) Period from August2010 to August2011 restated for the two-for-one share split , effective September2, 2011.
(2) During the trading session.