APC 2011 Annual Report Download - page 185
Download and view the complete annual report
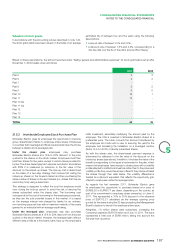
Please find page 185 of the 2011 APC annual report below. You can navigate through the pages in the report by either clicking on the pages listed below, or by using the keyword search tool below to find specific information within the annual report.-
 1
1 -
2
-
3
-
4
-
5
-
6
-
7
-
8
-
9
-
10
-
11
-
12
-
13
-
14
-
15
-
16
-
17
-
18
-
19
-
20
-
21
-
22
-
23
-
24
-
25
-
26
-
27
-
28
-
29
-
30
-
31
-
32
-
33
-
34
-
35
-
36
-
37
-
38
-
39
-
40
-
41
-
42
-
43
-
44
-
45
-
46
-
47
-
48
-
49
-
50
-
51
-
52
-
53
-
54
-
55
-
56
-
57
-
58
-
59
-
60
-
61
-
62
-
63
-
64
-
65
-
66
-
67
-
68
-
69
-
70
-
71
-
72
-
73
-
74
-
75
-
76
-
77
-
78
-
79
-
80
-
81
-
82
-
83
-
84
-
85
-
86
-
87
-
88
-
89
-
90
-
91
-
92
-
93
-
94
-
95
-
96
-
97
-
98
-
99
-
100
-
101
-
102
-
103
-
104
-
105
-
106
-
107
-
108
-
109
-
110
-
111
-
112
-
113
-
114
-
115
-
116
-
117
-
118
-
119
-
120
-
121
-
122
-
123
-
124
-
125
-
126
-
127
-
128
-
129
-
130
-
131
-
132
-
133
-
134
-
135
-
136
-
137
-
138
-
139
-
140
-
141
-
142
-
143
-
144
-
145
-
146
-
147
-
148
-
149
-
150
-
151
-
152
-
153
-
154
-
155
-
156
-
157
-
158
-
159
-
160
-
161
-
162
-
163
-
164
-
165
-
166
-
167
-
168
-
169
-
170
-
171
-
172
-
173
-
174
-
 175
175 -
 176
176 -
 177
177 -
 178
178 -
 179
179 -
 180
180 -
 181
181 -
 182
182 -
 183
183 -
 184
184 -
 185
185 -
 186
186 -
 187
187 -
 188
188 -
 189
189 -
 190
190 -
 191
191 -
 192
192 -
 193
193 -
 194
194 -
 195
195 -
196
-
197
-
198
-
199
-
200
-
201
-
202
-
203
-
204
-
205
-
206
-
207
-
208
-
209
-
210
-
211
-
212
-
213
-
214
-
215
-
216
-
217
-
218
-
219
-
220
-
221
-
222
-
223
-
224
-
225
-
226
-
227
-
228
-
229
-
230
-
231
-
232
-
233
-
234
-
235
-
236
-
237
-
238
-
239
-
240
-
241
-
242
-
243
-
244
-
245
-
246
-
247
-
248
-
249
-
250
-
251
-
252
-
253
-
254
-
255
-
256
-
257
-
258
-
259
-
260
-
261
-
262
-
263
-
264
-
265
-
266
-
267
-
268
-
269
-
270
-
271
-
272
-
273
-
274
-
275
-
276
-
277
-
278
-
279
-
280
 |
 |

1832011 REGISTRATION DOCUMENT SCHNEIDER ELECTRIC
CONSOLIDATED FINANCIAL STATEMENTS
5
NOTES TO THE CONSOLIDATED FINANCIAL
21.2 – Ownership structure
Dec.31, 2011 Dec.31, 2010
Capital Number of
shares Voting rights Number of
votingrights Capital Voting rights
%% %%
Capital Research andManagement
Company(1) 9.4 51,780,765 8.9 51,780,765 8.2 7.7
CDC 3.7 20,349,002 4.6 26,699,002 4.2 5.1
Employees 4.6 25,001,870 7.1 41,268,373 4.1 6.1
Own shares 0.0 1,058 - - - -
Treasury shares 1.7 9,164,952 - - 1.7 -
Public 80.6 442,645,377 78.0 455,807,950 81.8 79.4
TOTAL 100.0 548,943,024 100.0 584,722,100(2) 100.0 100.0
(1) To the best of the Company’s knowledge.
(2) Number of voting rights as defi ned in article223-11 of the AMF general regulations, which includes shares stripped of voting rights.
No shareholders’ pact was in effect as of December31, 2011.
21.3 – Earnings per share
These calculations are adjusted to refl ect the division of the par value by two, from 8 euros to 4 euros, effective September2, 2011.
Determination of the share base used in calculation
(in thousands of shares)
Dec.31, 2011 Dec.31, 2010
Basic Diluted Basic Diluted
Common shares* 537,422 537,422 521,786 521,786
Stock grants 2,890 1,184
Stock options 2,623 2,180
Average weighted number of shares 537,422 542,935 521,786 525,150
* Net of treasury shares and own shares.
Earnings per share
(In euros)
Dec.31, 2011 Dec.31, 2010
Basic Diluted Basic Diluted
Profi t before tax 4.54 4.49 4.51 4.48
EARNINGS PER SHARE 3.39 3.35 3.30 3.28
21.4 – Dividends paid and proposed
In 2011, the Group paid out the 2010 dividend of EUR3.20 per
share, for a total of EUR856million.
In 2010, the Group paid out the 2009 dividend of EUR2.05 per
share, for a total of EUR525million.
At the Shareholders’ Meeting of May 3, 2012, shareholders will
be asked to approve a dividend of EUR1.70 per share for 2011.
At December 31, 2011 Schneider Electric SA had distributable
reserves in an amount of EUR96million (versus EUR257million at
the previous year-end), not including profi t for the year.