APC 2011 Annual Report Download - page 184
Download and view the complete annual report
Please find page 184 of the 2011 APC annual report below. You can navigate through the pages in the report by either clicking on the pages listed below, or by using the keyword search tool below to find specific information within the annual report.-
 1
1 -
2
-
3
-
4
-
5
-
6
-
7
-
8
-
9
-
10
-
11
-
12
-
13
-
14
-
15
-
16
-
17
-
18
-
19
-
20
-
21
-
22
-
23
-
24
-
25
-
26
-
27
-
28
-
29
-
30
-
31
-
32
-
33
-
34
-
35
-
36
-
37
-
38
-
39
-
40
-
41
-
42
-
43
-
44
-
45
-
46
-
47
-
48
-
49
-
50
-
51
-
52
-
53
-
54
-
55
-
56
-
57
-
58
-
59
-
60
-
61
-
62
-
63
-
64
-
65
-
66
-
67
-
68
-
69
-
70
-
71
-
72
-
73
-
74
-
75
-
76
-
77
-
78
-
79
-
80
-
81
-
82
-
83
-
84
-
85
-
86
-
87
-
88
-
89
-
90
-
91
-
92
-
93
-
94
-
95
-
96
-
97
-
98
-
99
-
100
-
101
-
102
-
103
-
104
-
105
-
106
-
107
-
108
-
109
-
110
-
111
-
112
-
113
-
114
-
115
-
116
-
117
-
118
-
119
-
120
-
121
-
122
-
123
-
124
-
125
-
126
-
127
-
128
-
129
-
130
-
131
-
132
-
133
-
134
-
135
-
136
-
137
-
138
-
139
-
140
-
141
-
142
-
143
-
144
-
145
-
146
-
147
-
148
-
149
-
150
-
151
-
152
-
153
-
154
-
155
-
156
-
157
-
158
-
159
-
160
-
161
-
162
-
163
-
164
-
165
-
166
-
167
-
168
-
169
-
170
-
171
-
172
-
173
-
 174
174 -
 175
175 -
 176
176 -
 177
177 -
 178
178 -
 179
179 -
 180
180 -
 181
181 -
 182
182 -
 183
183 -
 184
184 -
 185
185 -
 186
186 -
 187
187 -
 188
188 -
 189
189 -
 190
190 -
 191
191 -
 192
192 -
 193
193 -
 194
194 -
195
-
196
-
197
-
198
-
199
-
200
-
201
-
202
-
203
-
204
-
205
-
206
-
207
-
208
-
209
-
210
-
211
-
212
-
213
-
214
-
215
-
216
-
217
-
218
-
219
-
220
-
221
-
222
-
223
-
224
-
225
-
226
-
227
-
228
-
229
-
230
-
231
-
232
-
233
-
234
-
235
-
236
-
237
-
238
-
239
-
240
-
241
-
242
-
243
-
244
-
245
-
246
-
247
-
248
-
249
-
250
-
251
-
252
-
253
-
254
-
255
-
256
-
257
-
258
-
259
-
260
-
261
-
262
-
263
-
264
-
265
-
266
-
267
-
268
-
269
-
270
-
271
-
272
-
273
-
274
-
275
-
276
-
277
-
278
-
279
-
280
 |
 |

182 2011 REGISTRATION DOCUMENT SCHNEIDER ELECTRIC
CONSOLIDATED FINANCIAL STATEMENTS
5NOTES TO THE CONSOLIDATED FINANCIAL
Note20
Cash and cash equivalents
Dec.31, 2011 Dec.31, 2010
Marketable securities 634 1,825
Negotiable debt securities and short-term deposits 622 115
Cash and cash equivalents 1,515 1,449
Total cash and cash equivalents 2,771 3,389
Bank overdrafts (217) (93)
NET CASH AND CASH EQUIVALENTS 2,554 3,296
Note21
Equity
21.1 – Capital
Share capital
At the Annual General Meeting held on April21, 2011 Schneider
Electric shareholders approved the division of the nominal value of
the shares by two. The operation took effect on September2, 2011
and resulted in the issuance of 271,959,091new shares.
The Company’s share capital at December31, 2011 amounted to
EUR2,195,772,096, represented by 548,943,024shares with a par
value of EUR4, all fully paid up.
At December31, 2011, a total of 548,722,100 voting rights were
attached to the 548,943,024shares outstanding.
Schneider Electric’s capital management strategy is designed to:
•ensure Group liquidity;
•optimise its fi nancial structure;
•optimise the weighted average cost of capital.
The strategy must also ensure the Group has access to different
capital markets under the best possible conditions. Factors taken
into account for decision-making purposes include objectives
expressed in terms of earnings per share, ratings or balance sheet
stability. Finally, decisions may be implemented depending on
specifi c market conditions.
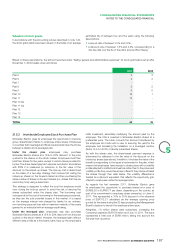
Changes in share capital
Changes in share capital since December31, 2010 were as follows:
Cumulative number of shares Total (in euros)
Capital at Dec.31, 2010 271,959,091 2,175,672,728
Division of the par value by two 271,959,091 -
Exercise of stock options 1,169,210 4,676,840
Employee share issue 3,855,632 15,422,528
CAPITAL AT DEC.31, 2011 548,943,024 2,195,772,096
The share premium account increased by EUR194,755,657following the exercise of options and the increases in capital.