APC 2011 Annual Report Download - page 101
Download and view the complete annual report
Please find page 101 of the 2011 APC annual report below. You can navigate through the pages in the report by either clicking on the pages listed below, or by using the keyword search tool below to find specific information within the annual report.-
 1
1 -
2
-
3
-
4
-
5
-
6
-
7
-
8
-
9
-
10
-
11
-
12
-
13
-
14
-
15
-
16
-
17
-
18
-
19
-
20
-
21
-
22
-
23
-
24
-
25
-
26
-
27
-
28
-
29
-
30
-
31
-
32
-
33
-
34
-
35
-
36
-
37
-
38
-
39
-
40
-
41
-
42
-
43
-
44
-
45
-
46
-
47
-
48
-
49
-
50
-
51
-
52
-
53
-
54
-
55
-
56
-
57
-
58
-
59
-
60
-
61
-
62
-
63
-
64
-
65
-
66
-
67
-
68
-
69
-
70
-
71
-
72
-
73
-
74
-
75
-
76
-
77
-
78
-
79
-
80
-
81
-
82
-
83
-
84
-
85
-
86
-
87
-
88
-
89
-
90
-
 91
91 -
 92
92 -
 93
93 -
 94
94 -
 95
95 -
 96
96 -
 97
97 -
 98
98 -
 99
99 -
 100
100 -
 101
101 -
 102
102 -
 103
103 -
 104
104 -
 105
105 -
 106
106 -
 107
107 -
 108
108 -
 109
109 -
 110
110 -
 111
111 -
112
-
113
-
114
-
115
-
116
-
117
-
118
-
119
-
120
-
121
-
122
-
123
-
124
-
125
-
126
-
127
-
128
-
129
-
130
-
131
-
132
-
133
-
134
-
135
-
136
-
137
-
138
-
139
-
140
-
141
-
142
-
143
-
144
-
145
-
146
-
147
-
148
-
149
-
150
-
151
-
152
-
153
-
154
-
155
-
156
-
157
-
158
-
159
-
160
-
161
-
162
-
163
-
164
-
165
-
166
-
167
-
168
-
169
-
170
-
171
-
172
-
173
-
174
-
175
-
176
-
177
-
178
-
179
-
180
-
181
-
182
-
183
-
184
-
185
-
186
-
187
-
188
-
189
-
190
-
191
-
192
-
193
-
194
-
195
-
196
-
197
-
198
-
199
-
200
-
201
-
202
-
203
-
204
-
205
-
206
-
207
-
208
-
209
-
210
-
211
-
212
-
213
-
214
-
215
-
216
-
217
-
218
-
219
-
220
-
221
-
222
-
223
-
224
-
225
-
226
-
227
-
228
-
229
-
230
-
231
-
232
-
233
-
234
-
235
-
236
-
237
-
238
-
239
-
240
-
241
-
242
-
243
-
244
-
245
-
246
-
247
-
248
-
249
-
250
-
251
-
252
-
253
-
254
-
255
-
256
-
257
-
258
-
259
-
260
-
261
-
262
-
263
-
264
-
265
-
266
-
267
-
268
-
269
-
270
-
271
-
272
-
273
-
274
-
275
-
276
-
277
-
278
-
279
-
280
 |
 |

REGISTRATION DOCUMENT 2011 SCHNEIDER ELECTRIC 99
SUSTAINABLE DEVELOPMENT
2
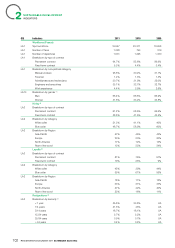
INDICATORS
GRI Indicators
Current Scope Constant Scope
2011 2010 2009 2011 2010
EN3 Coal (direct consumption) 4,432 4,641 4,594 UP UP
EN3 Renewable Energy (direct consumption) 11 25 22 UP UP
EN5 Energy consumption per employee (MWh) 11.7 ▲13.6 13.7 12.4 13.7
EN16
CO2 emissions linked to energy consumption
(in metric tonnes) (estimates)* 430,191 ▲411,177 357,513 400,280 407,224
EN17 Electricity (indirect emission) 348,316 323,429 278,809 UP UP
EN17 Heating (indirect emission) 11,728 10,995 9,570 UP UP
EN16 Fuel Oil (direct emission) 5,555 7,313 7,520 UP UP
EN16 Gas (direct emission) 63,080 67,857 60,048 UP UP
EN16 Coal (direct emission) 1,511 1,583 1,566 UP UP
EN16 Renewable Energy 0 0 0 UP UP
EN16 CO2/Employee (in metric tonnes/person) 4.2 ▲4.7 4.6 4.4 4.7
EN16
SF6 Emissions (in CO2 equivalent
metrictonnes)** 52,542 ▲60,491 135,895 49,661 93,761
EN16
Direct and Indirect CO2 Emissions (SF6energy
consumption and emissions inmetric tonnes) 482,733 ▲471,668 493,408 449,941 500,985
▲ 2011 Audited Indicators
UP =Unpublished
* T he CO2 emissions linked to energy consumption are considered estimates, because the indirect emissions are calculated on the
conversion factors per country.
** 9 sites used in 2009 and 2010, 17 sites in 2011 with the acquisition of Areva D, 15 sites for the constant scope calculations.
Constantscope emissions are not corrected from activity level.
Intensity indicators
The intensity ratios by workforce above only cover the scope of reporting sites. According to the 2012 carbon footprint, on the whole scopes
1 and 2 as per the GHG Protocol, the ratio of CO2 emissions/workforce at the Group level is estimated at 4.6.
The ratio of CO2 emissions/million of euros of turnover is: 29.1.