APC 2011 Annual Report Download - page 98
Download and view the complete annual report
Please find page 98 of the 2011 APC annual report below. You can navigate through the pages in the report by either clicking on the pages listed below, or by using the keyword search tool below to find specific information within the annual report.-
 1
1 -
2
-
3
-
4
-
5
-
6
-
7
-
8
-
9
-
10
-
11
-
12
-
13
-
14
-
15
-
16
-
17
-
18
-
19
-
20
-
21
-
22
-
23
-
24
-
25
-
26
-
27
-
28
-
29
-
30
-
31
-
32
-
33
-
34
-
35
-
36
-
37
-
38
-
39
-
40
-
41
-
42
-
43
-
44
-
45
-
46
-
47
-
48
-
49
-
50
-
51
-
52
-
53
-
54
-
55
-
56
-
57
-
58
-
59
-
60
-
61
-
62
-
63
-
64
-
65
-
66
-
67
-
68
-
69
-
70
-
71
-
72
-
73
-
74
-
75
-
76
-
77
-
78
-
79
-
80
-
81
-
82
-
83
-
84
-
85
-
86
-
87
-
 88
88 -
 89
89 -
 90
90 -
 91
91 -
 92
92 -
 93
93 -
 94
94 -
 95
95 -
 96
96 -
 97
97 -
 98
98 -
 99
99 -
 100
100 -
 101
101 -
 102
102 -
 103
103 -
 104
104 -
 105
105 -
 106
106 -
 107
107 -
 108
108 -
109
-
110
-
111
-
112
-
113
-
114
-
115
-
116
-
117
-
118
-
119
-
120
-
121
-
122
-
123
-
124
-
125
-
126
-
127
-
128
-
129
-
130
-
131
-
132
-
133
-
134
-
135
-
136
-
137
-
138
-
139
-
140
-
141
-
142
-
143
-
144
-
145
-
146
-
147
-
148
-
149
-
150
-
151
-
152
-
153
-
154
-
155
-
156
-
157
-
158
-
159
-
160
-
161
-
162
-
163
-
164
-
165
-
166
-
167
-
168
-
169
-
170
-
171
-
172
-
173
-
174
-
175
-
176
-
177
-
178
-
179
-
180
-
181
-
182
-
183
-
184
-
185
-
186
-
187
-
188
-
189
-
190
-
191
-
192
-
193
-
194
-
195
-
196
-
197
-
198
-
199
-
200
-
201
-
202
-
203
-
204
-
205
-
206
-
207
-
208
-
209
-
210
-
211
-
212
-
213
-
214
-
215
-
216
-
217
-
218
-
219
-
220
-
221
-
222
-
223
-
224
-
225
-
226
-
227
-
228
-
229
-
230
-
231
-
232
-
233
-
234
-
235
-
236
-
237
-
238
-
239
-
240
-
241
-
242
-
243
-
244
-
245
-
246
-
247
-
248
-
249
-
250
-
251
-
252
-
253
-
254
-
255
-
256
-
257
-
258
-
259
-
260
-
261
-
262
-
263
-
264
-
265
-
266
-
267
-
268
-
269
-
270
-
271
-
272
-
273
-
274
-
275
-
276
-
277
-
278
-
279
-
280
 |
 |

REGISTRATION DOCUMENT 2011 SCHNEIDER ELECTRIC96
SUSTAINABLE DEVELOPMENT
2METHODOLOGY ANDAUDIT OFINDICATORS
6.3 Statutory Auditors’ Report
Year ended December31, 2011
Statutory auditors’ report on a selection of environmental, safety, Human Resources and Planet &
Society Barometer indicators
To the Shareholders,
Further to your request and as statutory auditors of Schneider Electric, we have performed a review allowing us to express limited assurance
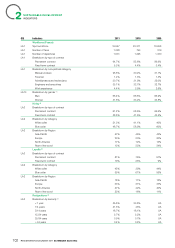
that the 29 indicators regarding environment, safety, human resources and Planet & Society Barometer for the 2011 fi scal year, identifi ed
with the ▲ symbol in the tables presented on pages 46, 52, 60, 70 et 98 to 105 of the annual report ("the Indicators" ), have been prepared,
in all material respects, in accordance with Schneider Electric 2011 reporting guidelines ("the Guidelines"), summarized on pages 90 to 92.
It is the responsibility of Schneider Electric’s management team to prepare the Indicators, draw up the Guidelines and ensure that the
Guidelines are available for consultation at the group’ s head offi ce.
Our responsibility is to express a conclusion on the Indicators, based on our review. Our review was carried out in accordance with the
international standard ISAE 3000 (International Standard on Assurance Engagement, December 2003). Our independence is defi ned by the
legislative and statutory texts as well as the ethics code of the profession.
The conclusion formulated below concerns only the specifi ed Indicators and not the entire sustainability report included in the annual report.
A higher level of assurance would have required more extensive work.
Nature and scope of our review
In order to be able to express our conclusion on the Indicators, we performed the following review:
•We conducted interviews with the persons responsible for the reporting on these Indicators as well as a risk and materiality analysis at
Group level. For EMEAS and North America regions, extended works were performed on safety Indicators.
•We also assessed compliance with the Guidelines and performed analytical procedures and consistency checks, as well as verifi ed, based
on sample surveys, data processing for the calculation of the Indicators and their aggregation.
•We selected a sample of fi ve operational sites(1) according to their activities, their geographic locations, their contribution to the group’ s
Indicators and the results of prior risk analyses.
•The selected sites represent on average 6% of the total value of the Indicators (from 2% to 35% depending on the Indicators(2)). At the
selected sites level, we verifi ed the understanding and application of the Guidelines, and verifi ed, on a test basis, compliance with the
calculation formula and reconciliation with supporting documents.
•We reviewed the presentation of the Indicators in the annual report on pages 46 to 80 and 98 to 105.
In view of the work carried out over the last seven years, we consider that our verifi cation work concerning the Indicators provide a suffi cient
basis on which to formulate our conclusion, presented hereafter.
(1) Spain (MESA site, Mungia) ; China (sites of SAS, Suzhou and SBMLV, Beijing) ; Mexico (site of Monterrey 3) ; USA (site of Pelco, Clovis,
California).
(2) 4% of energy consumption, 6% of water consumption, 5% of VOC emissions, 3% of waste production, 2% of recovered waste, 35% of SF6
leaks ; 7% of frequency rate and severity rate, 3% of salaried headcount, 4% of environmental headcount, 5% of average temporary workers,
3% of training hours.