APC 2011 Annual Report Download - page 104
Download and view the complete annual report
Please find page 104 of the 2011 APC annual report below. You can navigate through the pages in the report by either clicking on the pages listed below, or by using the keyword search tool below to find specific information within the annual report.-
 1
1 -
2
-
3
-
4
-
5
-
6
-
7
-
8
-
9
-
10
-
11
-
12
-
13
-
14
-
15
-
16
-
17
-
18
-
19
-
20
-
21
-
22
-
23
-
24
-
25
-
26
-
27
-
28
-
29
-
30
-
31
-
32
-
33
-
34
-
35
-
36
-
37
-
38
-
39
-
40
-
41
-
42
-
43
-
44
-
45
-
46
-
47
-
48
-
49
-
50
-
51
-
52
-
53
-
54
-
55
-
56
-
57
-
58
-
59
-
60
-
61
-
62
-
63
-
64
-
65
-
66
-
67
-
68
-
69
-
70
-
71
-
72
-
73
-
74
-
75
-
76
-
77
-
78
-
79
-
80
-
81
-
82
-
83
-
84
-
85
-
86
-
87
-
88
-
89
-
90
-
91
-
92
-
93
-
 94
94 -
 95
95 -
 96
96 -
 97
97 -
 98
98 -
 99
99 -
 100
100 -
 101
101 -
 102
102 -
 103
103 -
 104
104 -
 105
105 -
 106
106 -
 107
107 -
 108
108 -
 109
109 -
 110
110 -
 111
111 -
 112
112 -
 113
113 -
 114
114 -
115
-
116
-
117
-
118
-
119
-
120
-
121
-
122
-
123
-
124
-
125
-
126
-
127
-
128
-
129
-
130
-
131
-
132
-
133
-
134
-
135
-
136
-
137
-
138
-
139
-
140
-
141
-
142
-
143
-
144
-
145
-
146
-
147
-
148
-
149
-
150
-
151
-
152
-
153
-
154
-
155
-
156
-
157
-
158
-
159
-
160
-
161
-
162
-
163
-
164
-
165
-
166
-
167
-
168
-
169
-
170
-
171
-
172
-
173
-
174
-
175
-
176
-
177
-
178
-
179
-
180
-
181
-
182
-
183
-
184
-
185
-
186
-
187
-
188
-
189
-
190
-
191
-
192
-
193
-
194
-
195
-
196
-
197
-
198
-
199
-
200
-
201
-
202
-
203
-
204
-
205
-
206
-
207
-
208
-
209
-
210
-
211
-
212
-
213
-
214
-
215
-
216
-
217
-
218
-
219
-
220
-
221
-
222
-
223
-
224
-
225
-
226
-
227
-
228
-
229
-
230
-
231
-
232
-
233
-
234
-
235
-
236
-
237
-
238
-
239
-
240
-
241
-
242
-
243
-
244
-
245
-
246
-
247
-
248
-
249
-
250
-
251
-
252
-
253
-
254
-
255
-
256
-
257
-
258
-
259
-
260
-
261
-
262
-
263
-
264
-
265
-
266
-
267
-
268
-
269
-
270
-
271
-
272
-
273
-
274
-
275
-
276
-
277
-
278
-
279
-
280
 |
 |

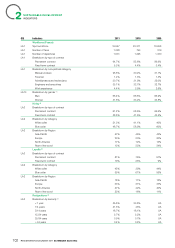
REGISTRATION DOCUMENT 2011 SCHNEIDER ELECTRIC102
SUSTAINABLE DEVELOPMENT
2INDICATORS
GRI Indicators 2011 2010 2009
Workforce (France)
LA1 Spot workforce 19,947 20,311 18,698
LA1 Number of hires 1,228 793 379
LA1 Number of departures 1,531 1,228 1,330
LA1 Breakdown by type of contract
Permanent contract 94.7% 95.6% 96.6%
Fixed-term contract 5.3% 4.4% 3.4%
LA1 Breakdown by occupational category
Manual workers 28.6% 30.2% 31.1%
Foremen 1.2% 1.3% 1.3%
Administrators and technicians 30.7% 31.9% 32.0%
Engineers and executives 35.1% 32.7% 32.7%
Work experience 4.4% 3.9% 2.9%
LA13 Breakdown by gender(7)
Men 68.4% 66.8% 66.2%
Women 31.6% 33.2% 33.8%
Hiring(6)
LA2 Breakdown by type of contract
Permanent contract 61.2% 58.5% 56.6%
Fixed-term contract 38.8% 41.5% 43.4%
LA2 Breakdown by category
White collar 51.3% 41.1% 40%
Blue collar 48.7% 58.9% 60%
LA2 Breakdown by Region
Asia-Pacifi c 47% 45% 43%
Europe 23% 20% 20%
North America 17% 12% 13%
Rest of the world 13% 23% 24%
Layoffs(6)
LA2 Breakdown by type of contract
Permanent contract 81% 75% 91%
Fixed-term contract 19% 25% 9%
LA2 Breakdown by category
White collar 45% 39% 44%
Blue collar 55% 61% 56%
LA2 Breakdown by Region
Asia-Pacifi c 18% 11% 12%
Europe 33% 31% 37%
North America 27% 42% 40%
Rest of the world 23% 16% 11%
Resignations(6)
LA2 Breakdown by seniority(2)
< 1 year 35.8% 33.8% UA
1/4years 41.5% 45% UA
5/14years 18.7% 18.1% UA
15/24years 2.7% 2.2% UA
25/34years 0.9% 0.7% UA
> 34years 0.4% 0.2% UA