Coca Cola 2003 Annual Report Download - page 100
Download and view the complete annual report
Please find page 100 of the 2003 Coca Cola annual report below. You can navigate through the pages in the report by either clicking on the pages listed below, or by using the keyword search tool below to find specific information within the annual report.-
 1
1 -
2
-
3
-
4
-
5
-
6
-
7
-
8
-
9
-
10
-
11
-
12
-
13
-
14
-
15
-
16
-
17
-
18
-
19
-
20
-
21
-
22
-
23
-
24
-
25
-
26
-
27
-
28
-
29
-
30
-
31
-
32
-
33
-
34
-
35
-
36
-
37
-
38
-
39
-
40
-
41
-
42
-
43
-
44
-
45
-
46
-
47
-
48
-
49
-
50
-
51
-
52
-
53
-
54
-
55
-
56
-
57
-
58
-
59
-
60
-
61
-
62
-
63
-
64
-
65
-
66
-
67
-
68
-
69
-
70
-
71
-
72
-
73
-
74
-
75
-
76
-
77
-
78
-
79
-
80
-
81
-
82
-
83
-
84
-
85
-
86
-
87
-
88
-
89
-
 90
90 -
 91
91 -
 92
92 -
 93
93 -
 94
94 -
 95
95 -
 96
96 -
 97
97 -
 98
98 -
 99
99 -
 100
100 -
 101
101 -
 102
102 -
 103
103 -
 104
104 -
 105
105 -
 106
106 -
 107
107 -
 108
108 -
 109
109 -
 110
110 -
111
-
112
-
113
-
114
-
115
-
116
-
117
-
118
-
119
-
120
-
121
-
122
-
123
 |
 |

NOTES TO CONSOLIDATED FINANCIAL STATEMENTS
The Coca-Cola Company and Subsidiaries
NOTE 18: ACQUISITIONS AND INVESTMENTS (Continued)
In December 2001, our Company completed a cash tender offer for all outstanding shares of the common
stock of Odwalla, Inc. This acquisition was valued at approximately $190 million with our Company receiving an
ownership interest of 100 percent.
During the first half of 2001, in separate transactions, our Company purchased two bottlers in Brazil:
Refrescos Guararapes Ltda. and Sucovalle Sucos e Concentrados do Vale S.A.
The acquisitions and investments have been accounted for by either the purchase method or equity method
of accounting, as appropriate. Their results have been included in our financial statements from their respective
dates of acquisition using the appropriate method of accounting. Assuming the results of these businesses had
been included in operations commencing with 2001, pro forma financial data would not be required due to
immateriality.
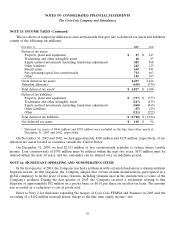
NOTE 19: OPERATING SEGMENTS
Our Company’s operating structure includes the following operating segments: North America; Africa; Asia;
Europe, Eurasia and Middle East; Latin America; and Corporate. North America includes the United States, Canada
and Puerto Rico. Prior-period amounts have been reclassified to conform to the current-period presentation.
Segment Products and Services
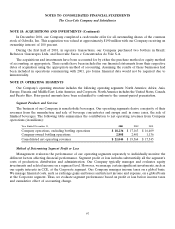
The business of our Company is nonalcoholic beverages. Our operating segments derive a majority of their
revenues from the manufacture and sale of beverage concentrates and syrups and, in some cases, the sale of
finished beverages. The following table summarizes the contribution to net operating revenues from Company
operations (in millions):
Year Ended December 31, 2003 2002 2001
Company operations, excluding bottling operations $ 18,236 $ 17,163 $ 16,409
Company-owned bottling operations 2,808 2,401 1,136
Consolidated net operating revenues $ 21,044 $ 19,564 $ 17,545
Method of Determining Segment Profit or Loss
Management evaluates the performance of our operating segments separately to individually monitor the
different factors affecting financial performance. Segment profit or loss includes substantially all the segment’s
costs of production, distribution and administration. Our Company typically manages and evaluates equity
investments and related income on a segment level. However, we manage certain significant investments, such as
our equity interests in CCE, at the Corporate segment. Our Company manages income taxes on a global basis.
We manage financial costs, such as exchange gains and losses and interest income and expense, on a global basis
at the Corporate segment. Thus, we evaluate segment performance based on profit or loss before income taxes
and cumulative effect of accounting change.
97