Coca Cola 2003 Annual Report Download - page 77
Download and view the complete annual report
Please find page 77 of the 2003 Coca Cola annual report below. You can navigate through the pages in the report by either clicking on the pages listed below, or by using the keyword search tool below to find specific information within the annual report.-
 1
1 -
2
-
3
-
4
-
5
-
6
-
7
-
8
-
9
-
10
-
11
-
12
-
13
-
14
-
15
-
16
-
17
-
18
-
19
-
20
-
21
-
22
-
23
-
24
-
25
-
26
-
27
-
28
-
29
-
30
-
31
-
32
-
33
-
34
-
35
-
36
-
37
-
38
-
39
-
40
-
41
-
42
-
43
-
44
-
45
-
46
-
47
-
48
-
49
-
50
-
51
-
52
-
53
-
54
-
55
-
56
-
57
-
58
-
59
-
60
-
61
-
62
-
63
-
64
-
65
-
66
-
 67
67 -
 68
68 -
 69
69 -
 70
70 -
 71
71 -
 72
72 -
 73
73 -
 74
74 -
 75
75 -
 76
76 -
 77
77 -
 78
78 -
 79
79 -
 80
80 -
 81
81 -
 82
82 -
 83
83 -
 84
84 -
 85
85 -
 86
86 -
 87
87 -
88
-
89
-
90
-
91
-
92
-
93
-
94
-
95
-
96
-
97
-
98
-
99
-
100
-
101
-
102
-
103
-
104
-
105
-
106
-
107
-
108
-
109
-
110
-
111
-
112
-
113
-
114
-
115
-
116
-
117
-
118
-
119
-
120
-
121
-
122
-
123
 |
 |

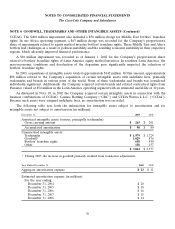
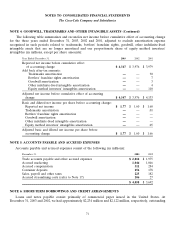
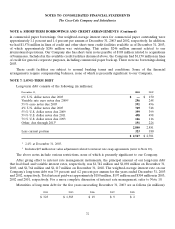
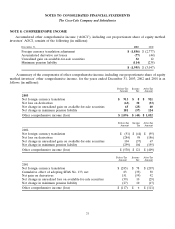
NOTES TO CONSOLIDATED FINANCIAL STATEMENTS
The Coca-Cola Company and Subsidiaries
NOTE 9: FINANCIAL INSTRUMENTS
Fair Value of Financial Instruments
The carrying amounts reflected in our balance sheets for cash, cash equivalents, marketable equity
securities, cost method investments, receivables, loans and notes payable, and long-term debt approximate their
respective fair values. Fair values are based primarily on quoted prices for those or similar instruments. Fair
values for our derivative financial instruments are included in Note 10.
Credit Risk
With respect to our cash and cash equivalents balances, we manage our exposure to counterparty credit risk
through specific minimum credit standards, diversification of counterparties and procedures to monitor
concentration of credit risk. Based on these factors, we consider the risk of counterparty default to be minimal.
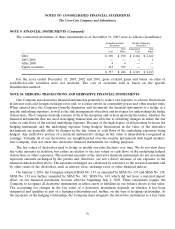
Certain Debt and Marketable Equity Securities
Investments in debt and marketable equity securities, other than investments accounted for by the equity
method, are required to be categorized as either trading, available-for-sale or held-to-maturity. On
December 31, 2003 and 2002, we had no trading securities. Securities categorized as available-for-sale are stated
at fair value, with unrealized gains and losses, net of deferred income taxes, reported as a component of AOCI.
Debt securities categorized as held-to-maturity are stated at amortized cost.
On December 31, 2003 and 2002, available-for-sale and held-to-maturity securities consisted of the
following (in millions):
Estimated
Gross Unrealized Fair
December 31, Cost Gains Losses Value
2003
Available-for-sale securities:
Bank and corporate debt $ 118 $ — $ — $ 118
Equity securities 143 97 (8) 232
Other debt securities 76 — — 76
$ 337 $ 97 $ (8) $ 426
Held-to-maturity securities:
Bank and corporate debt $ 2,162 $ — $ — $ 2,162
Other debt securities 1— — 1
$ 2,163 $ — $ — $ 2,163
74