Coca Cola 2003 Annual Report Download - page 36
Download and view the complete annual report
Please find page 36 of the 2003 Coca Cola annual report below. You can navigate through the pages in the report by either clicking on the pages listed below, or by using the keyword search tool below to find specific information within the annual report.-
 1
1 -
2
-
3
-
4
-
5
-
6
-
7
-
8
-
9
-
10
-
11
-
12
-
13
-
14
-
15
-
16
-
17
-
18
-
19
-
20
-
21
-
22
-
23
-
24
-
25
-
 26
26 -
 27
27 -
 28
28 -
 29
29 -
 30
30 -
 31
31 -
 32
32 -
 33
33 -
 34
34 -
 35
35 -
 36
36 -
 37
37 -
 38
38 -
 39
39 -
 40
40 -
 41
41 -
 42
42 -
 43
43 -
 44
44 -
 45
45 -
 46
46 -
47
-
48
-
49
-
50
-
51
-
52
-
53
-
54
-
55
-
56
-
57
-
58
-
59
-
60
-
61
-
62
-
63
-
64
-
65
-
66
-
67
-
68
-
69
-
70
-
71
-
72
-
73
-
74
-
75
-
76
-
77
-
78
-
79
-
80
-
81
-
82
-
83
-
84
-
85
-
86
-
87
-
88
-
89
-
90
-
91
-
92
-
93
-
94
-
95
-
96
-
97
-
98
-
99
-
100
-
101
-
102
-
103
-
104
-
105
-
106
-
107
-
108
-
109
-
110
-
111
-
112
-
113
-
114
-
115
-
116
-
117
-
118
-
119
-
120
-
121
-
122
-
123
 |
 |

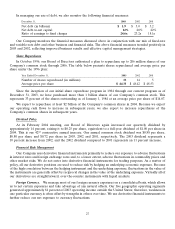
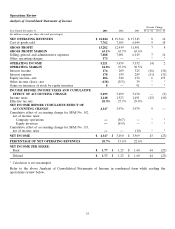
Operations Review
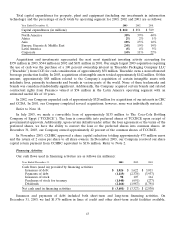
Analysis of Consolidated Statements of Income
Percent Change
Year Ended December 31, 2003 2002 2001 03 vs. 02 02 vs. 01
(In millions except per share data and percentages)
NET OPERATING REVENUES $ 21,044 $ 19,564 $ 17,545 8 12
Cost of goods sold 7,762 7,105 6,044 9 18
GROSS PROFIT 13,282 12,459 11,501 7 8
GROSS PROFIT MARGIN 63.1% 63.7% 65.6%
Selling, general and administrative expenses 7,488 7,001 6,149 7 14
Other operating charges 573 ——**
OPERATING INCOME 5,221 5,458 5,352 (4) 2
OPERATING MARGIN 24.8% 27.9% 30.5%
Interest income 176 209 325 (16) (36)
Interest expense 178 199 289 (11) (31)
Equity income—net 406 384 152 6 153
Other income (loss)—net (138) (353) 39 * *
Gains on issuances of stock by equity investees 8—91**
INCOME BEFORE INCOME TAXES AND CUMULATIVE
EFFECT OF ACCOUNTING CHANGE 5,495 5,499 5,670 — (3)
Income taxes 1,148 1,523 1,691 (25) (10)
Effective tax rate 20.9% 27.7% 29.8%
NET INCOME BEFORE CUMULATIVE EFFECT OF
ACCOUNTING CHANGE 4,347 3,976 3,979 9 —
Cumulative effect of accounting change for SFAS No. 142,
net of income taxes:
Company operations —(367) — * *
Equity investees —(559) — * *
Cumulative effect of accounting change for SFAS No. 133,
net of income taxes —— (10) * *
NET INCOME $ 4,347 $ 3,050 $ 3,969 43 (23)
PERCENTAGE OF NET OPERATING REVENUES 20.7% 15.6% 22.6%
NET INCOME PER SHARE:
Basic $ 1.77 $ 1.23 $ 1.60 44 (23)
Diluted $ 1.77 $ 1.23 $ 1.60 44 (23)
* Calculation is not meaningful.
Refer to the above Analysis of Consolidated Statements of Income in condensed form while reading the
operations review below.
33