Coca Cola 2003 Annual Report Download - page 30
Download and view the complete annual report
Please find page 30 of the 2003 Coca Cola annual report below. You can navigate through the pages in the report by either clicking on the pages listed below, or by using the keyword search tool below to find specific information within the annual report.-
 1
1 -
2
-
3
-
4
-
5
-
6
-
7
-
8
-
9
-
10
-
11
-
12
-
13
-
14
-
15
-
16
-
17
-
18
-
19
-
 20
20 -
 21
21 -
 22
22 -
 23
23 -
 24
24 -
 25
25 -
 26
26 -
 27
27 -
 28
28 -
 29
29 -
 30
30 -
 31
31 -
 32
32 -
 33
33 -
 34
34 -
 35
35 -
 36
36 -
 37
37 -
 38
38 -
 39
39 -
 40
40 -
41
-
42
-
43
-
44
-
45
-
46
-
47
-
48
-
49
-
50
-
51
-
52
-
53
-
54
-
55
-
56
-
57
-
58
-
59
-
60
-
61
-
62
-
63
-
64
-
65
-
66
-
67
-
68
-
69
-
70
-
71
-
72
-
73
-
74
-
75
-
76
-
77
-
78
-
79
-
80
-
81
-
82
-
83
-
84
-
85
-
86
-
87
-
88
-
89
-
90
-
91
-
92
-
93
-
94
-
95
-
96
-
97
-
98
-
99
-
100
-
101
-
102
-
103
-
104
-
105
-
106
-
107
-
108
-
109
-
110
-
111
-
112
-
113
-
114
-
115
-
116
-
117
-
118
-
119
-
120
-
121
-
122
-
123
 |
 |

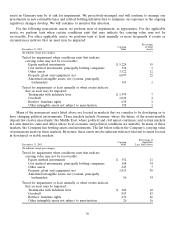
In managing our use of debt, we also monitor the following financial measures:
December 31, 2003 2002 2001
Net debt (in billions) $ 1.9 $ 3.0 $ 3.2
Net debt-to-net capital 12% 20% 22%
Ratio of earnings to fixed charges 24.6x 23.2x 18.1x
Our Company monitors the financial measures discussed above in conjunction with our mix of fixed-rate
and variable-rate debt and other business and financial risks. The above financial measures trended positively in
2003 and 2002, reflecting improved business results and effective capital management strategies.
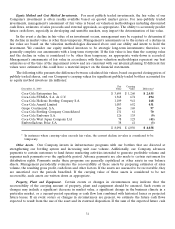
Share Repurchases
In October 1996, our Board of Directors authorized a plan to repurchase up to 206 million shares of our
Company’s common stock through 2006. The table below presents shares repurchased and average price per
share under the 1996 plan:
Year Ended December 31, 2003 2002 2001
Number of shares repurchased (in millions) 33 14 5
Average price per share $ 44.33 $ 48.42 $ 48.53
Since the inception of our initial share repurchase program in 1984 through our current program as of
December 31, 2003, we have purchased more than 1 billion shares of our Company’s common stock. This
represents 33 percent of the shares outstanding as of January 1, 1984 at an average price per share of $14.07.
We expect to repurchase at least $2 billion of the Company’s common shares in 2004. Because we expect
our operating cash flows to increase in subsequent years, we also expect to increase repurchases of the
Company’s common shares in subsequent years.
Dividend Policy
At its February 2004 meeting, our Board of Directors again increased our quarterly dividend by
approximately 14 percent, raising it to $0.25 per share, equivalent to a full-year dividend of $1.00 per share in
2004. This is our 42nd consecutive annual increase. Our annual common stock dividend was $0.88 per share,
$0.80 per share and $0.72 per share in 2003, 2002 and 2001, respectively. The 2003 dividend represents a
10 percent increase from 2002, and the 2002 dividend compared to 2001 represents an 11 percent increase.
Financial Risk Management
Our Company uses derivative financial instruments primarily to reduce our exposure to adverse fluctuations
in interest rates and foreign exchange rates and, to a lesser extent, adverse fluctuations in commodity prices and
other market risks. We do not enter into derivative financial instruments for trading purposes. As a matter of
policy, all our derivative positions are used to reduce risk by hedging an underlying economic exposure. Because
of the high correlation between the hedging instrument and the underlying exposure, fluctuations in the value of
the instruments are generally offset by reciprocal changes in the value of the underlying exposure. Virtually all of
our derivatives are straightforward, over-the-counter instruments with liquid markets.
Foreign Currency. We manage most of our foreign currency exposures on a consolidated basis, which allows
us to net certain exposures and take advantage of any natural offsets. Our five geographic operating segments
generated approximately 81 percent of 2003 operating income outside the United States; therefore, weakness in
one particular currency is often offset by strengths in others over time. We use derivative financial instruments to
further reduce our net exposure to currency fluctuations.
27