Coca Cola 2003 Annual Report Download - page 41
Download and view the complete annual report
Please find page 41 of the 2003 Coca Cola annual report below. You can navigate through the pages in the report by either clicking on the pages listed below, or by using the keyword search tool below to find specific information within the annual report.-
 1
1 -
2
-
3
-
4
-
5
-
6
-
7
-
8
-
9
-
10
-
11
-
12
-
13
-
14
-
15
-
16
-
17
-
18
-
19
-
20
-
21
-
22
-
23
-
24
-
25
-
26
-
27
-
28
-
29
-
30
-
 31
31 -
 32
32 -
 33
33 -
 34
34 -
 35
35 -
 36
36 -
 37
37 -
 38
38 -
 39
39 -
 40
40 -
 41
41 -
 42
42 -
 43
43 -
 44
44 -
 45
45 -
 46
46 -
 47
47 -
 48
48 -
 49
49 -
 50
50 -
 51
51 -
52
-
53
-
54
-
55
-
56
-
57
-
58
-
59
-
60
-
61
-
62
-
63
-
64
-
65
-
66
-
67
-
68
-
69
-
70
-
71
-
72
-
73
-
74
-
75
-
76
-
77
-
78
-
79
-
80
-
81
-
82
-
83
-
84
-
85
-
86
-
87
-
88
-
89
-
90
-
91
-
92
-
93
-
94
-
95
-
96
-
97
-
98
-
99
-
100
-
101
-
102
-
103
-
104
-
105
-
106
-
107
-
108
-
109
-
110
-
111
-
112
-
113
-
114
-
115
-
116
-
117
-
118
-
119
-
120
-
121
-
122
-
123
 |
 |

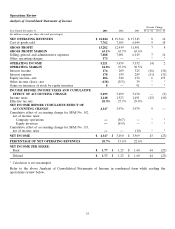
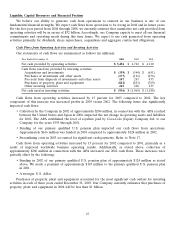
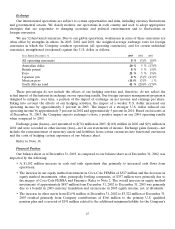
Operating Income and Operating Margin
Information about our operating income by operating segment on a percentage basis is as follows:
Year Ended December 31, 2003 2002 2001
North America 23.0 % 27.4 % 27.7 %
Africa 4.8 4.1 5.2
Asia 32.3 33.3 32.9
Europe, Eurasia & Middle East 36.5 29.5 27.3
Latin America 18.6 19.0 20.4
Corporate (15.2) (13.3) (13.5)
Operating income 100.0 % 100.0 % 100.0 %
As demonstrated by the table above, the percentage contribution to operating income by each operating
segment fluctuated from year to year. Operating income was influenced by a variety of factors and events,
primarily the following items:
• As a result of streamlining charges, 2003 operating income was reduced by $561 million as previously
discussed. Refer to Note 17.
• In 2003, as a result of the impact of adopting the fair value method of accounting for stock-based
compensation under SFAS No. 123, operating income was reduced by $127 million for North America,
$26 million for Africa, $55 million for Asia, $54 million for Europe, Eurasia and Middle East, $24 million
for Latin America and $113 million for Corporate. In 2002, as a result of the impact of adopting the fair
value method of accounting for stock-based compensation under SFAS No. 123, operating income was
reduced by $119 million for North America, $24 million for Africa, $51 million for Asia, $51 million for
Europe, Eurasia and Middle East, $22 million for Latin America and $106 million for Corporate. Refer
to Notes 13 and 19.
• In 2003, Europe, Eurasia and Middle East operating income significantly increased due to sound business
fundamentals, innovation, strong marketing strategies, rigorous cost management, positive currency
trends and favorable weather during the summer months.
• In 2002, Latin America was negatively impacted by exchange fluctuations and challenging economic
conditions, primarily in Argentina, Venezuela and Brazil.
• As a result of the Company’s receipt of a settlement related to a vitamin antitrust litigation matter,
operating income in 2003 increased by $52 million for Corporate. Refer to Note 16.
Interest Income and Interest Expense
In 2003, interest income decreased by $33 million compared to 2002 primarily due to lower interest rates
earned on short-term investments. Nevertheless, the Company continues to benefit from cash invested in
locations outside the United States earning higher interest rates than could be obtained within the United
States. Conversely, a majority of our interest expense is incurred on borrowings in the United States. Interest
expense in 2003 decreased by $21 million mainly as a result of both a decrease in average commercial paper debt
balances and lower interest rates for commercial paper borrowings.
A majority of the 2002 decrease of $116 million in interest income compared to 2001 was due to lower
interest rates earned on short-term investments during 2002. The 2002 decrease in interest expense of
$90 million versus 2001 was due to both a decrease in average commercial paper borrowings and lower interest
rates for commercial paper borrowings. The decrease in interest expense for commercial paper borrowings was
partially offset by increased interest expense on long-term debt related to the consolidation of CCEAG (refer to
Note 18) and the issuance during 2002 of $750 million of notes due June 1, 2005. The proceeds from this
$750 million long-term debt issuance were used to reduce current debt (refer to Note 7).
38