Coca Cola 2003 Annual Report Download - page 50
Download and view the complete annual report
Please find page 50 of the 2003 Coca Cola annual report below. You can navigate through the pages in the report by either clicking on the pages listed below, or by using the keyword search tool below to find specific information within the annual report.-
 1
1 -
2
-
3
-
4
-
5
-
6
-
7
-
8
-
9
-
10
-
11
-
12
-
13
-
14
-
15
-
16
-
17
-
18
-
19
-
20
-
21
-
22
-
23
-
24
-
25
-
26
-
27
-
28
-
29
-
30
-
31
-
32
-
33
-
34
-
35
-
36
-
37
-
38
-
39
-
 40
40 -
 41
41 -
 42
42 -
 43
43 -
 44
44 -
 45
45 -
 46
46 -
 47
47 -
 48
48 -
 49
49 -
 50
50 -
 51
51 -
 52
52 -
 53
53 -
 54
54 -
 55
55 -
 56
56 -
 57
57 -
 58
58 -
 59
59 -
 60
60 -
61
-
62
-
63
-
64
-
65
-
66
-
67
-
68
-
69
-
70
-
71
-
72
-
73
-
74
-
75
-
76
-
77
-
78
-
79
-
80
-
81
-
82
-
83
-
84
-
85
-
86
-
87
-
88
-
89
-
90
-
91
-
92
-
93
-
94
-
95
-
96
-
97
-
98
-
99
-
100
-
101
-
102
-
103
-
104
-
105
-
106
-
107
-
108
-
109
-
110
-
111
-
112
-
113
-
114
-
115
-
116
-
117
-
118
-
119
-
120
-
121
-
122
-
123
 |
 |

Exchange
Our international operations are subject to certain opportunities and risks, including currency fluctuations
and governmental actions. We closely monitor our operations in each country and seek to adopt appropriate
strategies that are responsive to changing economic and political environments and to fluctuations in
foreign currencies.
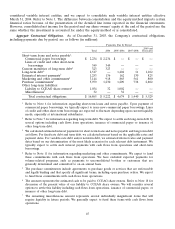
We use 52 functional currencies. Due to our global operations, weaknesses in some of these currencies are
often offset by strengths in others. In 2003, 2002 and 2001, the weighted-average exchange rates for foreign
currencies in which the Company conducts operations (all operating currencies), and for certain individual
currencies, strengthened (weakened) against the U.S. dollar as follows:
Year Ended December 31, 2003 2002 2001
All operating currencies 8% (3)% (8)%
Australian dollar 20 % 5 % (13)%
British pound 8% 5 % (5)%
Euro 21 % 5 % (5)%
Japanese yen 8% (3)% (11)%
Mexican peso (11)% (3)% 1 %
South African rand 41 % (20)% (17)%
These percentages do not include the effects of our hedging activities and, therefore, do not reflect the
actual impact of fluctuations in exchange on our operating results. Our foreign currency management program is
designed to mitigate, over time, a portion of the impact of exchange on net income and earnings per share.
Taking into account the effects of our hedging activities, the impact of a weaker U.S. dollar increased our
operating income by approximately 2 percent in 2003. The impact of a stronger U.S. dollar reduced our
operating income by approximately 3 percent in 2002 and approximately 5 percent in 2001. Based on forecasts as
of December 31, 2003, the Company expects exchange to have a positive impact on our 2004 operating results
when compared to 2003.
Exchange gains (losses)—net amounted to $(76) million in 2003, $(118) million in 2002 and $(9) million in
2001 and were recorded in other income (loss)—net in our statements of income. Exchange gains (losses)—net
include the remeasurement of monetary assets and liabilities from certain currencies into functional currencies
and the costs of hedging certain exposures of our balance sheet.
Refer to Note 10.
Financial Position
Our balance sheet as of December 31, 2003, as compared to our balance sheet as of December 31, 2002, was
impacted by the following:
• A $1,102 million increase in cash and cash equivalents due primarily to increased cash flows from
operations;
• The increase in our equity method investment in Coca-Cola FEMSA of $327 million and the decrease in
equity method investments, other, principally bottling companies, of $357 million were primarily due to
the merger of Coca-Cola FEMSA and Panamco. Refer to Note 2. The overall increase in equity method
investments of approximately $487 million from December 31, 2002 to December 31, 2003 was primarily
due to a benefit in 2003 currency translation and an increase in 2003 equity income, net of dividends.
• The increase in other assets from $2,694 million at December 31, 2002 to $3,322 million at December 31,
2003 resulted primarily from Company contributions of $166 million to the primary U.S. qualified
pension plan and a reversal of $191 million related to the additional minimum liability for the Company’s
47