Coca Cola 2003 Annual Report Download - page 66
Download and view the complete annual report
Please find page 66 of the 2003 Coca Cola annual report below. You can navigate through the pages in the report by either clicking on the pages listed below, or by using the keyword search tool below to find specific information within the annual report.-
 1
1 -
2
-
3
-
4
-
5
-
6
-
7
-
8
-
9
-
10
-
11
-
12
-
13
-
14
-
15
-
16
-
17
-
18
-
19
-
20
-
21
-
22
-
23
-
24
-
25
-
26
-
27
-
28
-
29
-
30
-
31
-
32
-
33
-
34
-
35
-
36
-
37
-
38
-
39
-
40
-
41
-
42
-
43
-
44
-
45
-
46
-
47
-
48
-
49
-
50
-
51
-
52
-
53
-
54
-
55
-
 56
56 -
 57
57 -
 58
58 -
 59
59 -
 60
60 -
 61
61 -
 62
62 -
 63
63 -
 64
64 -
 65
65 -
 66
66 -
 67
67 -
 68
68 -
 69
69 -
 70
70 -
 71
71 -
 72
72 -
 73
73 -
 74
74 -
 75
75 -
 76
76 -
77
-
78
-
79
-
80
-
81
-
82
-
83
-
84
-
85
-
86
-
87
-
88
-
89
-
90
-
91
-
92
-
93
-
94
-
95
-
96
-
97
-
98
-
99
-
100
-
101
-
102
-
103
-
104
-
105
-
106
-
107
-
108
-
109
-
110
-
111
-
112
-
113
-
114
-
115
-
116
-
117
-
118
-
119
-
120
-
121
-
122
-
123
 |
 |

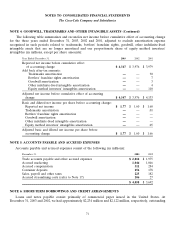
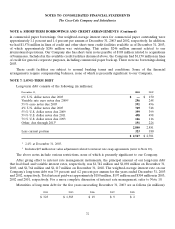
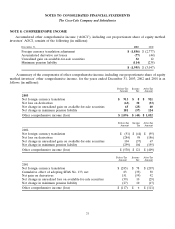
NOTES TO CONSOLIDATED FINANCIAL STATEMENTS
The Coca-Cola Company and Subsidiaries
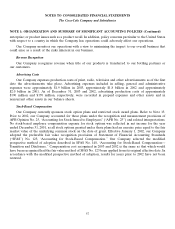
NOTE 1: ORGANIZATION AND SUMMARY OF SIGNIFICANT ACCOUNTING POLICIES (Continued)
authoritative guidance on the accounting for the federal subsidy is pending and that guidance, when issued,
could require our Company to change previously reported information.
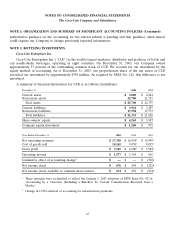
NOTE 2: BOTTLING INVESTMENTS
Coca-Cola Enterprises Inc.
Coca-Cola Enterprises Inc. (‘‘CCE’’) is the world’s largest marketer, distributor and producer of bottle and
can nonalcoholic beverages, operating in eight countries. On December 31, 2003, our Company owned
approximately 37 percent of the outstanding common stock of CCE. We account for our investment by the
equity method of accounting. As of December 31, 2003, our proportionate share of the net assets of CCE
exceeded our investment by approximately $358 million. As required by SFAS No. 142, this difference is not
amortized.
A summary of financial information for CCE is as follows (in millions):
December 31, 2003 2002
Current assets $ 3,000 $ 2,844
Noncurrent assets 22,700 21,531
Total assets $ 25,700 $ 24,375
Current liabilities $ 3,941 $ 3,455
Noncurrent liabilities 17,394 17,573
Total liabilities $ 21,335 $ 21,028
Share-owners’ equity $ 4,365 $ 3,347
Company equity investment $ 1,260 $ 972
Year Ended December 31, 2003 2002 2001
Net operating revenues $ 17,330 $ 16,0581$ 14,9991
Cost of goods sold 10,165 9,45819,0151
Gross profit $ 7,165 $ 6,6001$ 5,9841
Operating income $ 1,577 $ 1,364 $ 601
Cumulative effect of accounting change2$—$ — $ (302)
Net income (loss) $ 676 $ 494 $ (321)
Net income (loss) available to common share owners $ 674 $ 491 $ (324)
1These amounts were reclassified to reflect the January 1, 2003 adoption of EITF Issue No. 02-16,
‘‘Accounting by a Customer (Including a Reseller) for Certain Consideration Received from a
Vendor.’’
2Change in CCE’s method of accounting for infrastructure payments.
63