Coca Cola 2003 Annual Report Download - page 57
Download and view the complete annual report
Please find page 57 of the 2003 Coca Cola annual report below. You can navigate through the pages in the report by either clicking on the pages listed below, or by using the keyword search tool below to find specific information within the annual report.-
 1
1 -
2
-
3
-
4
-
5
-
6
-
7
-
8
-
9
-
10
-
11
-
12
-
13
-
14
-
15
-
16
-
17
-
18
-
19
-
20
-
21
-
22
-
23
-
24
-
25
-
26
-
27
-
28
-
29
-
30
-
31
-
32
-
33
-
34
-
35
-
36
-
37
-
38
-
39
-
40
-
41
-
42
-
43
-
44
-
45
-
46
-
 47
47 -
 48
48 -
 49
49 -
 50
50 -
 51
51 -
 52
52 -
 53
53 -
 54
54 -
 55
55 -
 56
56 -
 57
57 -
 58
58 -
 59
59 -
 60
60 -
 61
61 -
 62
62 -
 63
63 -
 64
64 -
 65
65 -
 66
66 -
 67
67 -
68
-
69
-
70
-
71
-
72
-
73
-
74
-
75
-
76
-
77
-
78
-
79
-
80
-
81
-
82
-
83
-
84
-
85
-
86
-
87
-
88
-
89
-
90
-
91
-
92
-
93
-
94
-
95
-
96
-
97
-
98
-
99
-
100
-
101
-
102
-
103
-
104
-
105
-
106
-
107
-
108
-
109
-
110
-
111
-
112
-
113
-
114
-
115
-
116
-
117
-
118
-
119
-
120
-
121
-
122
-
123
 |
 |

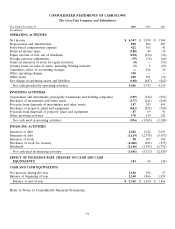
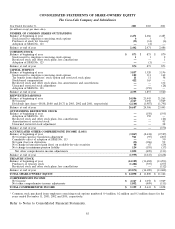
CONSOLIDATED STATEMENTS OF CASH FLOWS
The Coca-Cola Company and Subsidiaries
Year Ended December 31, 2003 2002 2001
(In millions)
OPERATING ACTIVITIES
Net income $ 4,347 $ 3,050 $ 3,969
Depreciation and amortization 850 806 803
Stock-based compensation expense 422 365 41
Deferred income taxes (188) 40 56
Equity income or loss, net of dividends (294) (256) (54)
Foreign currency adjustments (79) (76) (60)
Gains on issuances of stock by equity investees (8) — (91)
(Gains) losses on sales of assets, including bottling interests (5) 3 (85)
Cumulative effect of accounting changes —926 10
Other operating charges 330 ——
Other items 249 291 (17)
Net change in operating assets and liabilities (168) (407) (462)
Net cash provided by operating activities 5,456 4,742 4,110
INVESTING ACTIVITIES
Acquisitions and investments, principally trademarks and bottling companies (359) (544) (651)
Purchases of investments and other assets (177) (141) (456)
Proceeds from disposals of investments and other assets 147 243 455
Purchases of property, plant and equipment (812) (851) (769)
Proceeds from disposals of property, plant and equipment 87 69 91
Other investing activities 178 159 142
Net cash used in investing activities (936) (1,065) (1,188)
FINANCING ACTIVITIES
Issuances of debt 1,026 1,622 3,011
Payments of debt (1,119) (2,378) (3,937)
Issuances of stock 98 107 164
Purchases of stock for treasury (1,440) (691) (277)
Dividends (2,166) (1,987) (1,791)
Net cash used in financing activities (3,601) (3,327) (2,830)
EFFECT OF EXCHANGE RATE CHANGES ON CASH AND CASH
EQUIVALENTS 183 44 (45)
CASH AND CASH EQUIVALENTS
Net increase during the year 1,102 394 47
Balance at beginning of year 2,260 1,866 1,819
Balance at end of year $ 3,362 $ 2,260 $ 1,866
Refer to Notes to Consolidated Financial Statements.
54