Coca Cola 2003 Annual Report Download - page 31
Download and view the complete annual report
Please find page 31 of the 2003 Coca Cola annual report below. You can navigate through the pages in the report by either clicking on the pages listed below, or by using the keyword search tool below to find specific information within the annual report.-
 1
1 -
2
-
3
-
4
-
5
-
6
-
7
-
8
-
9
-
10
-
11
-
12
-
13
-
14
-
15
-
16
-
17
-
18
-
19
-
20
-
 21
21 -
 22
22 -
 23
23 -
 24
24 -
 25
25 -
 26
26 -
 27
27 -
 28
28 -
 29
29 -
 30
30 -
 31
31 -
 32
32 -
 33
33 -
 34
34 -
 35
35 -
 36
36 -
 37
37 -
 38
38 -
 39
39 -
 40
40 -
 41
41 -
42
-
43
-
44
-
45
-
46
-
47
-
48
-
49
-
50
-
51
-
52
-
53
-
54
-
55
-
56
-
57
-
58
-
59
-
60
-
61
-
62
-
63
-
64
-
65
-
66
-
67
-
68
-
69
-
70
-
71
-
72
-
73
-
74
-
75
-
76
-
77
-
78
-
79
-
80
-
81
-
82
-
83
-
84
-
85
-
86
-
87
-
88
-
89
-
90
-
91
-
92
-
93
-
94
-
95
-
96
-
97
-
98
-
99
-
100
-
101
-
102
-
103
-
104
-
105
-
106
-
107
-
108
-
109
-
110
-
111
-
112
-
113
-
114
-
115
-
116
-
117
-
118
-
119
-
120
-
121
-
122
-
123
 |
 |

Our Company enters into forward exchange contracts and purchases currency options (principally euro and
Japanese yen) and collars to hedge certain portions of forecasted cash flows denominated in foreign currencies.
Additionally, we enter into forward exchange contracts to offset the earnings impact relating to exchange rate
fluctuations on certain monetary assets and liabilities. We also enter into forward exchange contracts as hedges
of net investments in international operations.
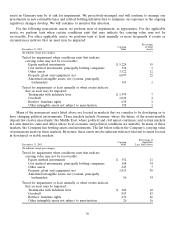
Interest Rates. We monitor our mix of fixed-rate and variable-rate debt, as well as our mix of term debt versus
nonterm debt. This monitoring includes a review of business and other financial risks as noted above. We also
enter into interest rate swap agreements to manage these risks.
Value at Risk. We monitor our exposure to financial market risks using several objective measurement
systems, including value-at-risk models. Our value-at-risk calculations use a historical simulation model to
estimate potential future losses in the fair value of our derivatives and other financial instruments that could
occur as a result of adverse movements in foreign currency and interest rates. We have not considered the
potential impact of favorable movements in foreign currency and interest rates on our calculations. We
examined historical weekly returns over the previous 10 years to calculate our value at risk. The average value at
risk represents the simple average of quarterly amounts over the past year. As a result of our foreign currency
value-at-risk calculations, we estimate with 95 percent confidence that the fair values of our foreign currency
derivatives and other financial instruments, over a one-week period, would decline by less than $26 million,
$34 million and $43 million, respectively, using 2003, 2002 or 2001 average fair values and by less than
$28 million and $31 million, respectively, using December 31, 2003 and 2002 fair values. According to our
interest rate value-at-risk calculations, we estimate with 95 percent confidence that any increase in our net
interest expense due to an adverse move in our 2003 average or in our December 31, 2003 interest rates over a
one-week period would not have a material impact on our financial statements. Our December 31, 2002 and
2001 estimates also were not material to our financial statements.
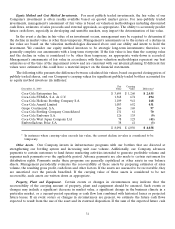
Application of Critical Accounting Policies
Management discussed with our Audit Committee the development, selection and disclosure of our critical
accounting policies and estimates and the application of these policies and estimates.
Basis of Presentation and Consolidation
Our consolidated financial statements are prepared in accordance with accounting principles generally
accepted in the United States. Our Company consolidates all entities that we control by ownership of a majority
voting interest. Refer to Note 1 for a discussion of variable interest entities.
We use the equity method to account for our investments for which we have the ability to exercise
significant influence over operating and financial policies. Our consolidated net income includes our Company’s
share of the net earnings of these companies. The difference between consolidation and the equity method
impacts certain financial ratios because of the presentation of the detailed line items reported in the financial
statements. However, our consolidated net income for the period and our share-owners’ equity at the end of the
period are the same whether the investment in the company is accounted for under the equity method or the
company is consolidated. Our judgments regarding the level of influence of each equity method investment
include considering key factors such as our ownership interest, representation on the board of directors,
participation in policy-making decisions and material intercompany transactions.
We use the cost method to account for our investments in companies that we do not control and for which
we do not have the ability to exercise significant influence over operating and financial policies. In accordance
with the cost method, these investments are recorded at cost or fair value, as appropriate. We record dividend
income when applicable dividends are declared.
28