Coca Cola 2003 Annual Report Download - page 69
Download and view the complete annual report
Please find page 69 of the 2003 Coca Cola annual report below. You can navigate through the pages in the report by either clicking on the pages listed below, or by using the keyword search tool below to find specific information within the annual report.-
 1
1 -
2
-
3
-
4
-
5
-
6
-
7
-
8
-
9
-
10
-
11
-
12
-
13
-
14
-
15
-
16
-
17
-
18
-
19
-
20
-
21
-
22
-
23
-
24
-
25
-
26
-
27
-
28
-
29
-
30
-
31
-
32
-
33
-
34
-
35
-
36
-
37
-
38
-
39
-
40
-
41
-
42
-
43
-
44
-
45
-
46
-
47
-
48
-
49
-
50
-
51
-
52
-
53
-
54
-
55
-
56
-
57
-
58
-
 59
59 -
 60
60 -
 61
61 -
 62
62 -
 63
63 -
 64
64 -
 65
65 -
 66
66 -
 67
67 -
 68
68 -
 69
69 -
 70
70 -
 71
71 -
 72
72 -
 73
73 -
 74
74 -
 75
75 -
 76
76 -
 77
77 -
 78
78 -
 79
79 -
80
-
81
-
82
-
83
-
84
-
85
-
86
-
87
-
88
-
89
-
90
-
91
-
92
-
93
-
94
-
95
-
96
-
97
-
98
-
99
-
100
-
101
-
102
-
103
-
104
-
105
-
106
-
107
-
108
-
109
-
110
-
111
-
112
-
113
-
114
-
115
-
116
-
117
-
118
-
119
-
120
-
121
-
122
-
123
 |
 |

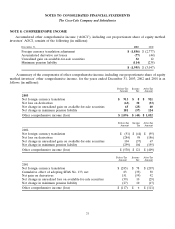
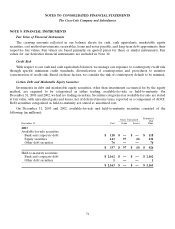
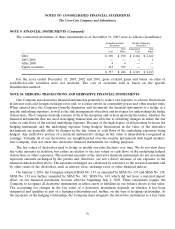
NOTES TO CONSOLIDATED FINANCIAL STATEMENTS
The Coca-Cola Company and Subsidiaries
NOTE 2: BOTTLING INVESTMENTS (Continued)
Other Equity Investments
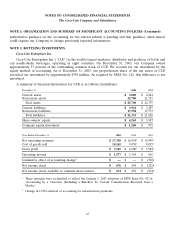
Operating results include our proportionate share of income (loss) from our equity investments. A summary
of financial information for our equity investments in the aggregate, other than CCE, is as follows (in millions):
December 31, 2003 2002
Current assets $ 6,416 $ 5,649
Noncurrent assets 17,394 14,453
Total assets $ 23,810 $ 20,102
Current liabilities $ 5,467 $ 4,816
Noncurrent liabilities 9,011 6,010
Total liabilities $ 14,478 $ 10,826
Share-owners’ equity $ 9,332 $ 9,276
Company equity investment $ 3,964 $ 3,765
Year Ended December 31, 2003 2002 2001
Net operating revenues $ 19,797 $ 17,7141$ 19,7401
Cost of goods sold 11,661 10,112111,3371
Gross profit $ 8,136 $ 7,6021$ 8,4031
Operating income $ 1,666 $ 1,744 $ 1,770
Cumulative effect of accounting change2$—$ (1,428) $ —
Net income (loss) $ 580 $ (630) $ 735
Equity investments include nonbottling investees.
1These amounts were reclassified to reflect the January 1, 2003 adoption of EITF Issue No. 02-16,
‘‘Accounting by a Customer (Including a Reseller) for Certain Consideration Received from a
Vendor.’’
2Accounting change is the adoption of SFAS No. 142.
Net sales to equity investees other than CCE, the majority of which are located outside the United States,
were $4.0 billion in 2003, $3.2 billion in 2002 and $3.7 billion in 2001. Total support payments, primarily
marketing, made to equity investees other than CCE were approximately $511 million, $488 million and
$636 million for 2003, 2002 and 2001, respectively.
Effective May 6, 2003, one of our Company’s equity method investees, Coca-Cola FEMSA, S.A. de C.V.
(‘‘Coca-Cola FEMSA’’) consummated a merger with another of the Company’s equity method investees,
Panamerican Beverages, Inc. (‘‘Panamco’’). Our Company received new Coca-Cola FEMSA shares in exchange
for all Panamco shares previously held by the Company. Our Company’s ownership interest in Coca-Cola
FEMSA increased from 30 percent to approximately 40 percent as a result of this merger. This exchange of
shares was treated as a nonmonetary exchange of similar productive assets, and no gain was recorded by our
Company as a result of this merger.
66