Coca Cola 2003 Annual Report Download - page 23
Download and view the complete annual report
Please find page 23 of the 2003 Coca Cola annual report below. You can navigate through the pages in the report by either clicking on the pages listed below, or by using the keyword search tool below to find specific information within the annual report.-
 1
1 -
2
-
3
-
4
-
5
-
6
-
7
-
8
-
9
-
10
-
11
-
12
-
 13
13 -
 14
14 -
 15
15 -
 16
16 -
 17
17 -
 18
18 -
 19
19 -
 20
20 -
 21
21 -
 22
22 -
 23
23 -
 24
24 -
 25
25 -
 26
26 -
 27
27 -
 28
28 -
 29
29 -
 30
30 -
 31
31 -
 32
32 -
 33
33 -
34
-
35
-
36
-
37
-
38
-
39
-
40
-
41
-
42
-
43
-
44
-
45
-
46
-
47
-
48
-
49
-
50
-
51
-
52
-
53
-
54
-
55
-
56
-
57
-
58
-
59
-
60
-
61
-
62
-
63
-
64
-
65
-
66
-
67
-
68
-
69
-
70
-
71
-
72
-
73
-
74
-
75
-
76
-
77
-
78
-
79
-
80
-
81
-
82
-
83
-
84
-
85
-
86
-
87
-
88
-
89
-
90
-
91
-
92
-
93
-
94
-
95
-
96
-
97
-
98
-
99
-
100
-
101
-
102
-
103
-
104
-
105
-
106
-
107
-
108
-
109
-
110
-
111
-
112
-
113
-
114
-
115
-
116
-
117
-
118
-
119
-
120
-
121
-
122
-
123
 |
 |

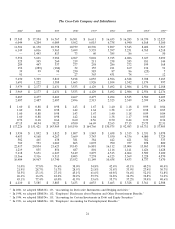
ITEM 6. SELECTED FINANCIAL DATA
The Coca-Cola Company and Subsidiaries
Compound Growth Rates Year Ended December 31,
(In millions except per share data, ratios and growth rates) 5 Years 10 Years 2003220023,4
SUMMARY OF OPERATIONS
Net operating revenues 5.2 % 5.3% $ 21,044 $ 19,564
Cost of goods sold 6.9 % 4.2% 7,762 7,105
Gross profit 4.3 % 6.1% 13,282 12,459
Selling, general and administrative expenses 5.6 % 5.9% 7,488 7,001
Other operating charges 573 —
Operating income 1.0 % 5.4% 5,221 5,458
Interest income 176 209
Interest expense 178 199
Equity income (loss)—net 406 384
Other income (loss)—net (138) (353)
Gains on issuances of stock by equity investees 8—
Income before income taxes and changes in accounting principles 1.1 % 5.6% 5,495 5,499
Income taxes (7.2)% 1.4% 1,148 1,523
Net income before changes in accounting principles 4.2 % 7.1% $ 4,347 $ 3,976
Net income 4.2 % 7.2% $ 4,347 $ 3,050
Average shares outstanding 2,459 2,478
Average shares outstanding assuming dilution 2,462 2,483
PER SHARE DATA
Income before changes in accounting principles—basic 4.4 % 7.7% $ 1.77 $ 1.60
Income before changes in accounting principles—diluted 4.5 % 7.9% 1.77 1.60
Basic net income 4.4 % 7.7% 1.77 1.23
Diluted net income 4.5 % 7.9% 1.77 1.23
Cash dividends 8.0 % 10.0% 0.88 0.80
Market price on December 31, (5.4)% 8.6% 50.75 43.84
TOTAL MARKET VALUE OF COMMON STOCK1(5.6)% 7.9% $ 123,908 $ 108,328
BALANCE SHEET AND OTHER DATA
Cash, cash equivalents and current marketable securities $ 3,482 $ 2,345
Property, plant and equipment—net 6,097 5,911
Depreciation 667 614
Capital expenditures 812 851
Total assets 27,342 24,406
Long-term debt 2,517 2,701
Total debt 5,423 5,356
Share-owners’ equity 14,090 11,800
Total capital119,513 17,156
OTHER KEY FINANCIAL MEASURES1
Total debt-to-total capital 27.8% 31.2%
Net debt-to-net capital 12.1% 20.3%
Return on common equity 33.6% 34.3%
Return on capital 24.5% 24.5%
Dividend payout ratio 49.8% 65.1%
Net cash provided by operations $ 5,456 $ 4,742
1Refer to Glossary on pages 103 and 104.
2In 2003, we adopted SFAS No. 146, ‘‘Accounting for Costs Associated with Exit or Disposal Activities.’’
3In 2002, we adopted SFAS No. 142, ‘‘Goodwill and Other Intangible Assets.’’
4In 2002, we adopted the fair value method provisions of SFAS No. 123, ‘‘Accounting for Stock-Based Compensation,’’ and we adopted
SFAS No. 148, ‘‘Accounting for Stock-Based Compensation—Transition and Disclosure.’’
20