Coca Cola 2003 Annual Report Download - page 102
Download and view the complete annual report
Please find page 102 of the 2003 Coca Cola annual report below. You can navigate through the pages in the report by either clicking on the pages listed below, or by using the keyword search tool below to find specific information within the annual report.-
 1
1 -
2
-
3
-
4
-
5
-
6
-
7
-
8
-
9
-
10
-
11
-
12
-
13
-
14
-
15
-
16
-
17
-
18
-
19
-
20
-
21
-
22
-
23
-
24
-
25
-
26
-
27
-
28
-
29
-
30
-
31
-
32
-
33
-
34
-
35
-
36
-
37
-
38
-
39
-
40
-
41
-
42
-
43
-
44
-
45
-
46
-
47
-
48
-
49
-
50
-
51
-
52
-
53
-
54
-
55
-
56
-
57
-
58
-
59
-
60
-
61
-
62
-
63
-
64
-
65
-
66
-
67
-
68
-
69
-
70
-
71
-
72
-
73
-
74
-
75
-
76
-
77
-
78
-
79
-
80
-
81
-
82
-
83
-
84
-
85
-
86
-
87
-
88
-
89
-
90
-
91
-
 92
92 -
 93
93 -
 94
94 -
 95
95 -
 96
96 -
 97
97 -
 98
98 -
 99
99 -
 100
100 -
 101
101 -
 102
102 -
 103
103 -
 104
104 -
 105
105 -
 106
106 -
 107
107 -
 108
108 -
 109
109 -
 110
110 -
 111
111 -
 112
112 -
113
-
114
-
115
-
116
-
117
-
118
-
119
-
120
-
121
-
122
-
123
 |
 |

NOTES TO CONSOLIDATED FINANCIAL STATEMENTS
The Coca-Cola Company and Subsidiaries
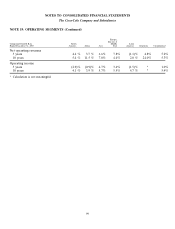
NOTE 19: OPERATING SEGMENTS (Continued)
Europe,
Eurasia &
Compound Growth Rate North Middle Latin
Ended December 31, 2003 America Africa Asia East America Corporate Consolidated
Net operating revenues
5 years 4.4 % 3.7 % 6.6% 7.8% (1.1)% 4.8% 5.2%
10 years 5.4 % 11.5 % 7.0% 4.4% 2.0 % 24.0% 5.3%
Operating income
5 years (2.9)% (0.9)% 4.7% 3.4% (1.5)% * 1.0%
10 years 4.1 % 3.9 % 5.7% 5.5% 4.7 % * 5.4%
* Calculation is not meaningful.
99