Coca Cola 2003 Annual Report Download - page 58
Download and view the complete annual report
Please find page 58 of the 2003 Coca Cola annual report below. You can navigate through the pages in the report by either clicking on the pages listed below, or by using the keyword search tool below to find specific information within the annual report.-
 1
1 -
2
-
3
-
4
-
5
-
6
-
7
-
8
-
9
-
10
-
11
-
12
-
13
-
14
-
15
-
16
-
17
-
18
-
19
-
20
-
21
-
22
-
23
-
24
-
25
-
26
-
27
-
28
-
29
-
30
-
31
-
32
-
33
-
34
-
35
-
36
-
37
-
38
-
39
-
40
-
41
-
42
-
43
-
44
-
45
-
46
-
47
-
 48
48 -
 49
49 -
 50
50 -
 51
51 -
 52
52 -
 53
53 -
 54
54 -
 55
55 -
 56
56 -
 57
57 -
 58
58 -
 59
59 -
 60
60 -
 61
61 -
 62
62 -
 63
63 -
 64
64 -
 65
65 -
 66
66 -
 67
67 -
 68
68 -
69
-
70
-
71
-
72
-
73
-
74
-
75
-
76
-
77
-
78
-
79
-
80
-
81
-
82
-
83
-
84
-
85
-
86
-
87
-
88
-
89
-
90
-
91
-
92
-
93
-
94
-
95
-
96
-
97
-
98
-
99
-
100
-
101
-
102
-
103
-
104
-
105
-
106
-
107
-
108
-
109
-
110
-
111
-
112
-
113
-
114
-
115
-
116
-
117
-
118
-
119
-
120
-
121
-
122
-
123
 |
 |
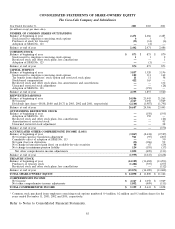
CONSOLIDATED STATEMENTS OF SHARE-OWNERS’ EQUITY
The Coca-Cola Company and Subsidiaries
Year Ended December 31, 2003 2002 2001
(In millions except per share data)
NUMBER OF COMMON SHARES OUTSTANDING
Balance at beginning of year 2,471 2,486 2,485
Stock issued to employees exercising stock options 437
Purchases of stock for treasury1(33) (14) (6)
Adoption of SFAS No. 123 —(4) —
Balance at end of year 2,442 2,471 2,486
COMMON STOCK
Balance at beginning of year $ 873 $ 873 $ 870
Stock issued to employees exercising stock options 112
Restricted stock and other stock plans, less cancellations ——1
Adoption of SFAS No. 123 —(1) —
Balance at end of year 874 873 873
CAPITAL SURPLUS
Balance at beginning of year 3,857 3,520 3,196
Stock issued to employees exercising stock options 105 111 162
Tax benefit from employees’ stock option and restricted stock plans 11 11 58
Stock-based compensation 422 365 —
Restricted stock and other stock plans, less amortization and cancellations —— 132
Unearned restricted stock adjustment —— (28)
Adoption of SFAS No. 123 —(150) —
Balance at end of year 4,395 3,857 3,520
REINVESTED EARNINGS
Balance at beginning of year 24,506 23,443 21,265
Net income 4,347 3,050 3,969
Dividends (per share—$0.88, $0.80 and $0.72 in 2003, 2002 and 2001, respectively) (2,166) (1,987) (1,791)
Balance at end of year 26,687 24,506 23,443
OUTSTANDING RESTRICTED STOCK
Balance at beginning of year —(150) (195)
Adoption of SFAS No. 123 —150 —
Restricted stock and other stock plans, less cancellations —— (24)
Amortization of restricted stock ——41
Unearned restricted stock adjustment ——28
Balance at end of year —— (150)
ACCUMULATED OTHER COMPREHENSIVE INCOME (LOSS)
Balance at beginning of year (3,047) (2,638) (2,527)
Net foreign currency translation adjustment 921 (95) (207)
Cumulative effect of adoption of SFAS No. 133 ——50
Net gain (loss) on derivatives (33) (186) 92
Net change in unrealized gain (loss) on available-for-sale securities 40 67 (29)
Net change in minimum pension liability 124 (195) (17)
Net other comprehensive income adjustments 1,052 (409) (111)
Balance at end of year (1,995) (3,047) (2,638)
TREASURY STOCK
Balance at beginning of year (14,389) (13,682) (13,293)
Purchases of treasury stock (1,482) (707) (277)
Restricted stock and other stock plans, less cancellations —— (112)
Balance at end of year (15,871) (14,389) (13,682)
TOTAL SHARE-OWNERS’ EQUITY $ 14,090 $ 11,800 $ 11,366
COMPREHENSIVE INCOME
Net income $ 4,347 $ 3,050 $ 3,969
Net other comprehensive income adjustments 1,052 (409) (111)
TOTAL COMPREHENSIVE INCOME $ 5,399 $ 2,641 $ 3,858
1Common stock purchased from employees exercising stock options numbered 0.4 million, 0.2 million and 0.3 million shares for the
years ended December 31, 2003, 2002 and 2001, respectively.
Refer to Notes to Consolidated Financial Statements.
55