Coca Cola 2003 Annual Report Download - page 39
Download and view the complete annual report
Please find page 39 of the 2003 Coca Cola annual report below. You can navigate through the pages in the report by either clicking on the pages listed below, or by using the keyword search tool below to find specific information within the annual report.-
 1
1 -
2
-
3
-
4
-
5
-
6
-
7
-
8
-
9
-
10
-
11
-
12
-
13
-
14
-
15
-
16
-
17
-
18
-
19
-
20
-
21
-
22
-
23
-
24
-
25
-
26
-
27
-
28
-
 29
29 -
 30
30 -
 31
31 -
 32
32 -
 33
33 -
 34
34 -
 35
35 -
 36
36 -
 37
37 -
 38
38 -
 39
39 -
 40
40 -
 41
41 -
 42
42 -
 43
43 -
 44
44 -
 45
45 -
 46
46 -
 47
47 -
 48
48 -
 49
49 -
50
-
51
-
52
-
53
-
54
-
55
-
56
-
57
-
58
-
59
-
60
-
61
-
62
-
63
-
64
-
65
-
66
-
67
-
68
-
69
-
70
-
71
-
72
-
73
-
74
-
75
-
76
-
77
-
78
-
79
-
80
-
81
-
82
-
83
-
84
-
85
-
86
-
87
-
88
-
89
-
90
-
91
-
92
-
93
-
94
-
95
-
96
-
97
-
98
-
99
-
100
-
101
-
102
-
103
-
104
-
105
-
106
-
107
-
108
-
109
-
110
-
111
-
112
-
113
-
114
-
115
-
116
-
117
-
118
-
119
-
120
-
121
-
122
-
123
 |
 |

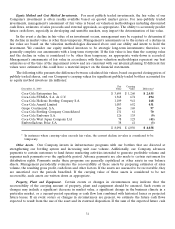
Our cost of goods sold increased in 2002 compared to 2001 primarily as a result of the acquisitions of our
interests in Odwalla, the CCDA water brands and CBC and the structural change of CCEAG. Total combined
2002 cost of goods sold for these entities was $844 million.
Our decrease in 2002 gross profit margin was due primarily to the consolidation of lower-margin
operations, primarily the CCEAG structural change and the acquisitions of our interests in Odwalla, the CCDA
water brands and CBC. These decreases were partially offset by the sale and resulting deconsolidation of our
Russian and Baltics bottling operations. Generally, bottling, canning and vending operations produce higher net
revenues but lower gross profit margins compared to concentrate and syrup operations.
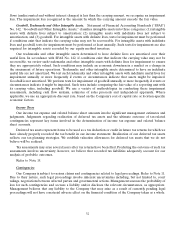
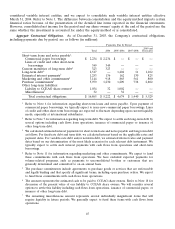
Selling, General and Administrative Expenses
The following table includes the significant components of selling, general and administrative expenses (in
millions):
Year Ended December 31, 2003 2002 2001
Selling expenses $ 3,074 $ 2,915 $ 2,395
Advertising expenses 1,905 1,775 1,970
General and administrative expenses 2,102 1,946 1,743
Stock-based compensation expense 407 365 41
Selling, general and administrative expenses $ 7,488 $ 7,001 $ 6,149
Selling, general and administrative expenses were approximately 7 percent higher in 2003 versus 2002.
Approximately 4 percentage points of this increase were due to an overall weaker U.S. dollar (primarily
compared to the euro). These expenses also increased by $75 million as a result of increases for benefit plans,
including defined benefit pension plans, defined contribution pension plans, and postretirement health care and
life insurance benefits plans. Selling expenses increased by approximately $32 million due to the inclusion of one
additional month of operations for CCEAG in 2003 compared to 2002. The Seagram’s mixers, the CCDA water
brands and Evian transactions during 2002 resulted in an increase of approximately $43 million in selling,
general and administrative expenses as a result of including full-year expenses in 2003 compared to only a
portion of 2002. These increases were partially offset by effective management of operating expenses.
Acquisitions of our interests in Odwalla, CCDA and CBC and the structural change of CCEAG increased
selling expenses by $430 million and general and administrative expenses by $136 million in 2002. These
increases were partially offset by the sale and resulting deconsolidation of our Russian and Baltics
bottling operations.
The adoption of SFAS No. 142 and its related impact is discussed in Notes 1 and 4. Upon adoption of SFAS
No. 142, intangible assets that have indefinite lives and goodwill previously amortized are no longer amortized.
Due to the adoption of SFAS No. 142, amortization expense for 2002 was reduced by approximately $60 million.
Substantially all such amortization expense was included in the general and administrative expenses line item.
As discussed in Notes 1 and 13, effective January 1, 2002, our Company adopted the preferable fair value
recognition provisions of SFAS No. 123, ‘‘Accounting for Stock-Based Compensation’’ and selected the modified
prospective transition method under the provisions of SFAS No. 148, ‘‘Accounting for Stock-Based
Compensation—Transition and Disclosure.’’ Prior to 2002, our Company accounted for stock-based
compensation under the recognition and measurement provisions of APB Opinion No. 25, ‘‘Accounting for
Stock Issued to Employees’’ (‘‘APB No. 25’’) and related interpretations. For stock options, no stock-based
employee compensation expense was reflected in net income for the year ended December 31, 2001. In 2001, the
Company recorded $41 million in stock-based compensation expense for its restricted stock plans. In 2003 and
2002, stock-based compensation expense was recognized as if the fair value method of SFAS No. 123 had been
36