Coca Cola 2004 Annual Report Download - page 104
Download and view the complete annual report
Please find page 104 of the 2004 Coca Cola annual report below. You can navigate through the pages in the report by either clicking on the pages listed below, or by using the keyword search tool below to find specific information within the annual report.-
 1
1 -
2
-
3
-
4
-
5
-
6
-
7
-
8
-
9
-
10
-
11
-
12
-
13
-
14
-
15
-
16
-
17
-
18
-
19
-
20
-
21
-
22
-
23
-
24
-
25
-
26
-
27
-
28
-
29
-
30
-
31
-
32
-
33
-
34
-
35
-
36
-
37
-
38
-
39
-
40
-
41
-
42
-
43
-
44
-
45
-
46
-
47
-
48
-
49
-
50
-
51
-
52
-
53
-
54
-
55
-
56
-
57
-
58
-
59
-
60
-
61
-
62
-
63
-
64
-
65
-
66
-
67
-
68
-
69
-
70
-
71
-
72
-
73
-
74
-
75
-
76
-
77
-
78
-
79
-
80
-
81
-
82
-
83
-
84
-
85
-
86
-
87
-
88
-
89
-
90
-
91
-
92
-
93
-
 94
94 -
 95
95 -
 96
96 -
 97
97 -
 98
98 -
 99
99 -
 100
100 -
 101
101 -
 102
102 -
 103
103 -
 104
104 -
 105
105 -
 106
106 -
 107
107 -
 108
108 -
 109
109 -
 110
110 -
 111
111 -
 112
112 -
 113
113 -
 114
114 -
115
-
116
-
117
-
118
-
119
-
120
-
121
-
122
-
123
-
124
-
125
-
126
-
127
-
128
-
129
-
130
-
131
-
132
-
133
-
134
-
135
-
136
-
137
-
138
-
139
-
140
 |
 |

NOTES TO CONSOLIDATED FINANCIAL STATEMENTS
The Coca-Cola Company and Subsidiaries
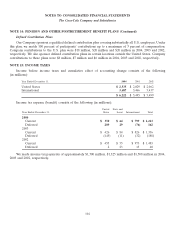
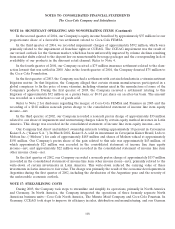
NOTE 14: PENSION AND OTHER POSTRETIREMENT BENEFIT PLANS (Continued)
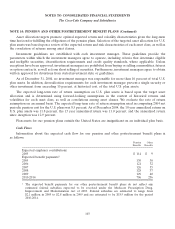
The assumed health care cost trend rates are as follows:
December 31, 2004 2003
Health care cost trend rate assumed for next year 91⁄2%10%
Rate to which the cost trend rate is assumed to decline (the ultimate trend rate) 51⁄4%51⁄4%
Year that the rate reaches the ultimate trend rate 2010 2009
Assumed health care cost trend rates have a significant effect on the amounts reported for the
postretirement health care plans. A one percentage point change in the assumed health care cost trend rate
would have the following effects (in millions):
One Percentage Point One Percentage Point
Increase Decrease
Effect on accumulated postretirement benefit obligation as
of December 31, 2004 $ 128 $ (111)
Effect on total of service cost and interest cost in 2004 $ 13 $ (11)
The discount rate assumptions used to account for pension and other postretirement benefit plans reflect
the rates at which the benefit obligations could be effectively settled. These rates were determined using a cash
flow matching technique whereby a hypothetical portfolio of high quality debt securities was constructed that
mirrors the specific benefit obligations for each of our primary plans. The rate of compensation increase
assumption is determined by the Company based upon annual reviews. We review external data and our own
historical trends for health care costs to determine the health care cost trend rate assumptions.
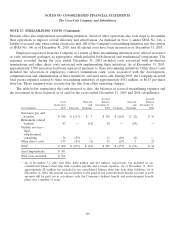
Plan Assets
The following table sets forth the actual asset allocation and weighted-average target asset allocation for
our U.S. and non-U.S. pension plan assets:
Target Asset
December 31, 2004 2003 Allocation
Equity securities160% 60% 56%
Debt securities 31% 32% 35%
Real estate and other29% 8% 9%
Total 100% 100% 100%
1As of December 31, 2004 and 2003, 3 percent and 4 percent, respectively, of total pension plan assets
were invested in common stock of our Company.
2As of December 31, 2004 and 2003, 4 percent of total pension plan assets were invested in real estate.
Investment objectives for the Company’s U.S. pension plan assets, which comprise 72 percent of total
pension plan assets as of December 31, 2004, are to:
(1) optimize the long-term return on plan assets at an acceptable level of risk;
(2) maintain a broad diversification across asset classes and among investment managers;
(3) maintain careful control of the risk level within each asset class; and
(4) focus on a long-term return objective.
102