Coca Cola 2004 Annual Report Download - page 40
Download and view the complete annual report
Please find page 40 of the 2004 Coca Cola annual report below. You can navigate through the pages in the report by either clicking on the pages listed below, or by using the keyword search tool below to find specific information within the annual report.-
 1
1 -
2
-
3
-
4
-
5
-
6
-
7
-
8
-
9
-
10
-
11
-
12
-
13
-
14
-
15
-
16
-
17
-
18
-
19
-
20
-
21
-
22
-
23
-
24
-
25
-
26
-
27
-
28
-
29
-
 30
30 -
 31
31 -
 32
32 -
 33
33 -
 34
34 -
 35
35 -
 36
36 -
 37
37 -
 38
38 -
 39
39 -
 40
40 -
 41
41 -
 42
42 -
 43
43 -
 44
44 -
 45
45 -
 46
46 -
 47
47 -
 48
48 -
 49
49 -
 50
50 -
51
-
52
-
53
-
54
-
55
-
56
-
57
-
58
-
59
-
60
-
61
-
62
-
63
-
64
-
65
-
66
-
67
-
68
-
69
-
70
-
71
-
72
-
73
-
74
-
75
-
76
-
77
-
78
-
79
-
80
-
81
-
82
-
83
-
84
-
85
-
86
-
87
-
88
-
89
-
90
-
91
-
92
-
93
-
94
-
95
-
96
-
97
-
98
-
99
-
100
-
101
-
102
-
103
-
104
-
105
-
106
-
107
-
108
-
109
-
110
-
111
-
112
-
113
-
114
-
115
-
116
-
117
-
118
-
119
-
120
-
121
-
122
-
123
-
124
-
125
-
126
-
127
-
128
-
129
-
130
-
131
-
132
-
133
-
134
-
135
-
136
-
137
-
138
-
139
-
140
 |
 |

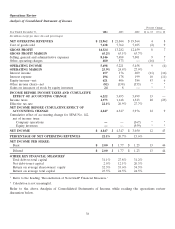
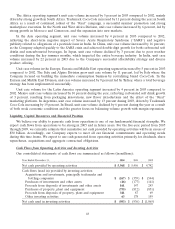
Operations Review
Analysis of Consolidated Statements of Income
Percent Change
Year Ended December 31, 2004 2003 2002 04 vs. 03 03 vs. 02
(In millions except per share data and percentages)
NET OPERATING REVENUES $ 21,962 $ 21,044 $ 19,564 4 8
Cost of goods sold 7,638 7,762 7,105 (2) 9
GROSS PROFIT 14,324 13,282 12,459 8 7
GROSS PROFIT MARGIN 65.2% 63.1% 63.7%
Selling, general and administrative expenses 8,146 7,488 7,001 9 7
Other operating charges 480 573 — (16) *
OPERATING INCOME 5,698 5,221 5,458 9 (4)
OPERATING MARGIN 25.9% 24.8% 27.9%
Interest income 157 176 209 (11) (16)
Interest expense 196 178 199 10 (11)
Equity income—net 621 406 384 53 6
Other income (loss)—net (82) (138) (353) * *
Gains on issuances of stock by equity investees 24 8—**
INCOME BEFORE INCOME TAXES AND CUMULATIVE
EFFECT OF ACCOUNTING CHANGE 6,222 5,495 5,499 13 —
Income taxes 1,375 1,148 1,523 20 (25)
Effective tax rate 22.1% 20.9% 27.7%
NET INCOME BEFORE CUMULATIVE EFFECT OF
ACCOUNTING CHANGE 4,847 4,347 3,976 12 9
Cumulative effect of accounting change for SFAS No. 142,
net of income taxes:
Company operations —— (367) * *
Equity investees —— (559) * *
NET INCOME $ 4,847 $ 4,347 $ 3,050 12 43
PERCENTAGE OF NET OPERATING REVENUES 22.1% 20.7% 15.6%
NET INCOME PER SHARE:
Basic $ 2.00 $ 1.77 $ 1.23 13 44
Diluted $ 2.00 $ 1.77 $ 1.23 13 44
OTHER KEY FINANCIAL MEASURES1
Total debt-to-total capital 31.1% 27.8% 31.2%
Net debt-to-net capital 2.5% 12.1% 20.3%
Return on average shareowners’ equity 32.3% 33.6% 34.3%
Return on average total capital 23.5% 24.5% 24.5%
1Refer to the heading ‘‘Reconciliation of Non-GAAP Financial Measures.’’
* Calculation is not meaningful.
Refer to the above Analysis of Consolidated Statements of Income while reading the operations review
discussion below.
38