Coca Cola 2004 Annual Report Download - page 33
Download and view the complete annual report
Please find page 33 of the 2004 Coca Cola annual report below. You can navigate through the pages in the report by either clicking on the pages listed below, or by using the keyword search tool below to find specific information within the annual report.-
 1
1 -
2
-
3
-
4
-
5
-
6
-
7
-
8
-
9
-
10
-
11
-
12
-
13
-
14
-
15
-
16
-
17
-
18
-
19
-
20
-
21
-
22
-
 23
23 -
 24
24 -
 25
25 -
 26
26 -
 27
27 -
 28
28 -
 29
29 -
 30
30 -
 31
31 -
 32
32 -
 33
33 -
 34
34 -
 35
35 -
 36
36 -
 37
37 -
 38
38 -
 39
39 -
 40
40 -
 41
41 -
 42
42 -
 43
43 -
44
-
45
-
46
-
47
-
48
-
49
-
50
-
51
-
52
-
53
-
54
-
55
-
56
-
57
-
58
-
59
-
60
-
61
-
62
-
63
-
64
-
65
-
66
-
67
-
68
-
69
-
70
-
71
-
72
-
73
-
74
-
75
-
76
-
77
-
78
-
79
-
80
-
81
-
82
-
83
-
84
-
85
-
86
-
87
-
88
-
89
-
90
-
91
-
92
-
93
-
94
-
95
-
96
-
97
-
98
-
99
-
100
-
101
-
102
-
103
-
104
-
105
-
106
-
107
-
108
-
109
-
110
-
111
-
112
-
113
-
114
-
115
-
116
-
117
-
118
-
119
-
120
-
121
-
122
-
123
-
124
-
125
-
126
-
127
-
128
-
129
-
130
-
131
-
132
-
133
-
134
-
135
-
136
-
137
-
138
-
139
-
140
 |
 |

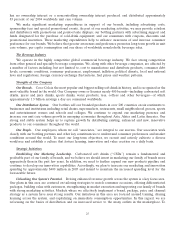
estimate potential future losses in the fair value of our derivatives and other financial instruments that could
occur as a result of adverse movements in foreign currency and interest rates. We have not considered the
potential impact of favorable movements in foreign currency and interest rates on our calculations. We
examined historical weekly returns over the previous 10 years to calculate our value at risk. The average value at
risk represents the simple average of quarterly amounts over the past year. As a result of our foreign currency
value-at-risk calculations, we estimate with 95 percent confidence that the fair values of our foreign currency
derivatives and other financial instruments, over a one-week period, would decline by less than $17 million,
$26 million and $34 million, respectively, using 2004, 2003 or 2002 average fair values and by less than
$18 million and $28 million, respectively, using December 31, 2004 and 2003 fair values. According to our
interest rate value-at-risk calculations, we estimate with 95 percent confidence that any increase in our net
interest expense due to an adverse move in our 2004 average or in our December 31, 2004 interest rates over a
one-week period would not have a material impact on our consolidated financial statements. Our December 31,
2003 and 2002 estimates were not material to our consolidated financial statements.
Application of Critical Accounting Policies
Management discussed with our Audit Committee the development, selection and disclosure of our critical
accounting policies and estimates and the application of these policies and estimates.
Basis of Presentation and Consolidation
Our consolidated financial statements are prepared in accordance with generally accepted accounting
principles in the United States (‘‘GAAP’’). Our Company consolidates all entities that we control by ownership
of a majority voting interest as well as variable interest entities for which our Company is the primary
beneficiary. Refer to Note 1 for a discussion of variable interest entities.
We use the equity method to account for investments for which we have the ability to exercise significant
influence over operating and financial policies. Our consolidated net income includes our Company’s share of
the net earnings of these companies. The difference between consolidation and the equity method impacts
certain financial ratios because of the presentation of the detailed line items reported in the financial
statements. However, our consolidated net income for the period and our shareowners’ equity at the end of the
period are the same whether the investment in the company is accounted for under the equity method or the
company is consolidated. Our judgments regarding the level of influence over each equity method investment
include considering key factors such as our ownership interest, representation on the board of directors,
participation in policy-making decisions and material intercompany transactions.
We use the cost method to account for investments in companies that we do not control and for which we
do not have the ability to exercise significant influence over operating and financial policies. In accordance with
the cost method, these investments are recorded at cost or fair value, as appropriate. We record dividend income
when applicable dividends are declared.
Our Company eliminates from financial results all significant intercompany transactions, including the
intercompany portion of transactions with equity method investees.
Effective February 2002, our Company acquired control of Coca-Cola Erfrischungsgetraenke AG
(‘‘CCEAG’’), the largest bottler of the Company’s beverage products in Germany. Under our policy, we
concluded that CCEAG should be consolidated in our consolidated financial statements. Prior to February 2002,
our Company accounted for CCEAG under the equity method of accounting. At that time, our Company had
approximately 41 percent ownership interest in the outstanding shares of CCEAG. In February 2002, in
accordance with the terms of the Control and Profit and Loss Transfer Agreement (‘‘CPL’’), our Company
obtained control of CCEAG for a period of up to five years. Furthermore, we also entered into a Pooling
Agreement with certain shareowners of CCEAG that provided our Company with voting control of CCEAG. In
return for control of CCEAG, the Company guaranteed annual payments in lieu of dividends by CCEAG, to all
other CCEAG shareowners. Additionally, all other CCEAG shareowners entered into either a put or a put/call
option agreement with the Company, exercisable at any time up to December 31, 2006. Our Company entered
31