Coca Cola 2004 Annual Report Download - page 42
Download and view the complete annual report
Please find page 42 of the 2004 Coca Cola annual report below. You can navigate through the pages in the report by either clicking on the pages listed below, or by using the keyword search tool below to find specific information within the annual report.-
 1
1 -
2
-
3
-
4
-
5
-
6
-
7
-
8
-
9
-
10
-
11
-
12
-
13
-
14
-
15
-
16
-
17
-
18
-
19
-
20
-
21
-
22
-
23
-
24
-
25
-
26
-
27
-
28
-
29
-
30
-
31
-
 32
32 -
 33
33 -
 34
34 -
 35
35 -
 36
36 -
 37
37 -
 38
38 -
 39
39 -
 40
40 -
 41
41 -
 42
42 -
 43
43 -
 44
44 -
 45
45 -
 46
46 -
 47
47 -
 48
48 -
 49
49 -
 50
50 -
 51
51 -
 52
52 -
53
-
54
-
55
-
56
-
57
-
58
-
59
-
60
-
61
-
62
-
63
-
64
-
65
-
66
-
67
-
68
-
69
-
70
-
71
-
72
-
73
-
74
-
75
-
76
-
77
-
78
-
79
-
80
-
81
-
82
-
83
-
84
-
85
-
86
-
87
-
88
-
89
-
90
-
91
-
92
-
93
-
94
-
95
-
96
-
97
-
98
-
99
-
100
-
101
-
102
-
103
-
104
-
105
-
106
-
107
-
108
-
109
-
110
-
111
-
112
-
113
-
114
-
115
-
116
-
117
-
118
-
119
-
120
-
121
-
122
-
123
-
124
-
125
-
126
-
127
-
128
-
129
-
130
-
131
-
132
-
133
-
134
-
135
-
136
-
137
-
138
-
139
-
140
 |
 |

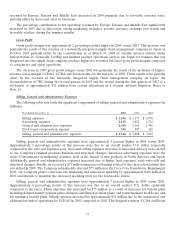
The impact of currency fluctuations versus the U.S. dollar in 2004 was driven primarily by the stronger euro
which favorably impacted the Europe, Eurasia and Middle East operating segment, and the stronger yen which
favorably impacted the Asia operating segment. Refer to the heading ‘‘Liquidity, Capital Resources and
Financial Position—Exchange.’’
The increase in gallon sales in 2003 included the favorable impact of the consolidation of full year results in
2003 for 2002 acquisitions. In the second quarter of 2002, our Company entered into a long-term license
agreement involving Seagram’s mixers, a carbonated line of drinks. In the third quarter of 2002, our Company
and DWNA formed a new joint venture company, CCDA, for the production, marketing and distribution of
DWNA’s bottled spring and source water business in the United States. We own a controlling 51 percent interest
in the joint venture company, with a license for the use of the Dannon and Sparkletts brands as well as
ownership of several value brands. Also in the third quarter of 2002, we entered into a master distribution
agreement for the Evian water brand in the United States and Canada. Gallons shipped in 2003 increased when
compared to 2002 as a result of owning and operating these businesses throughout 2003 compared to only
owning and operating them for a portion of 2002.
Structural changes resulted in a decrease in net operating revenues in 2003 compared to 2002 due partially
to the deconsolidation of Cosmos Bottling Corporation (‘‘CBC’’) during the second quarter of 2003 and the
creation of a national supply chain company in Japan effective October 1, 2003 as discussed above. This decrease
was partially offset by the inclusion of one additional month of revenue from CCEAG. CCEAG was
consolidated in February 2002; therefore, the 2002 period contained only 11 months of CCEAG revenues versus
the full year in 2003.
The size and timing of structural changes, including acquisitions or disposition of bottling and canning
operations, do not occur consistently from period to period. As a result, anticipating the impact of such events
on future increases or decreases in net operating revenues (and other financial statement line items) usually is
not possible. However, we expect to continue to sell bottling and canning interests and buy bottling and canning
interests in limited circumstances and, as a result, structural changes will continue to affect our consolidated
financial statements in future periods.
The impact of currency fluctuations versus the U.S. dollar in 2003 was driven primarily by the stronger euro
which favorably impacted the Europe, Eurasia and Middle East operating segment and the stronger yen which
favorably impacted the Asia operating segment. This impact was partially offset by generally weaker currencies
negatively impacting our Latin America operating segment.
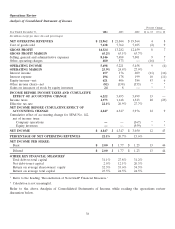
Information about our net operating revenues by operating segment on a percentage basis is as follows:
Year Ended December 31, 2004 2003 2002
North America 30.2% 30.1% 32.0%
Africa 4.9 3.9 3.5
Asia 21.3 24.0 25.8
Europe, Eurasia and Middle East 32.8 31.2 26.9
Latin America 9.7 9.7 10.7
Corporate 1.1 1.1 1.1
Net operating revenues 100.0% 100.0% 100.0%
The percentage contribution to net operating revenues by Africa increased in 2004 due to significant
volume increases in South Africa as a result of successful marketing strategies, favorable currency rates and the
consolidation of our bottling operations in Egypt under Interpretation 46. The percentage contribution to net
operating revenues by Asia declined in 2004 due to the creation of an integrated supply chain management
company in Japan, partially offset by favorable currency rates. The percentage contribution to net operating
40