Coca Cola 2004 Annual Report Download - page 56
Download and view the complete annual report
Please find page 56 of the 2004 Coca Cola annual report below. You can navigate through the pages in the report by either clicking on the pages listed below, or by using the keyword search tool below to find specific information within the annual report.-
 1
1 -
2
-
3
-
4
-
5
-
6
-
7
-
8
-
9
-
10
-
11
-
12
-
13
-
14
-
15
-
16
-
17
-
18
-
19
-
20
-
21
-
22
-
23
-
24
-
25
-
26
-
27
-
28
-
29
-
30
-
31
-
32
-
33
-
34
-
35
-
36
-
37
-
38
-
39
-
40
-
41
-
42
-
43
-
44
-
45
-
 46
46 -
 47
47 -
 48
48 -
 49
49 -
 50
50 -
 51
51 -
 52
52 -
 53
53 -
 54
54 -
 55
55 -
 56
56 -
 57
57 -
 58
58 -
 59
59 -
 60
60 -
 61
61 -
 62
62 -
 63
63 -
 64
64 -
 65
65 -
 66
66 -
67
-
68
-
69
-
70
-
71
-
72
-
73
-
74
-
75
-
76
-
77
-
78
-
79
-
80
-
81
-
82
-
83
-
84
-
85
-
86
-
87
-
88
-
89
-
90
-
91
-
92
-
93
-
94
-
95
-
96
-
97
-
98
-
99
-
100
-
101
-
102
-
103
-
104
-
105
-
106
-
107
-
108
-
109
-
110
-
111
-
112
-
113
-
114
-
115
-
116
-
117
-
118
-
119
-
120
-
121
-
122
-
123
-
124
-
125
-
126
-
127
-
128
-
129
-
130
-
131
-
132
-
133
-
134
-
135
-
136
-
137
-
138
-
139
-
140
 |
 |

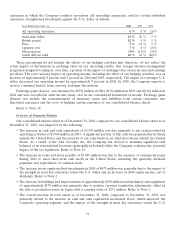
currencies in which the Company conducts operations (all operating currencies), and for certain individual
currencies, strengthened (weakened) against the U.S. dollar as follows:
Year Ended December 31, 2004 2003 2002
All operating currencies 6% 8 % (3)%
Australian dollar 13 % 20 % 5 %
British pound 12 % 8% 5%
Euro 9% 21 % 5 %
Japanese yen 7% 8 % (3)%
Mexican peso (5)% (11)% (3)%
South African rand 18 % 41 % (20)%
These percentages do not include the effects of our hedging activities and, therefore, do not reflect the
actual impact of fluctuations in exchange rates on our operating results. Our foreign currency management
program is designed to mitigate, over time, a portion of the impact of exchange rates on net income and earnings
per share. The total currency impact on operating income, including the effect of our hedging activities, was an
increase of approximately 8 percent and 2 percent in 2004 and 2003, respectively. The impact of a stronger U.S.
dollar decreased our operating income by approximately 3 percent in 2002. In 2005, the Company expects to
receive a minimal benefit from currency exchange fluctuations.
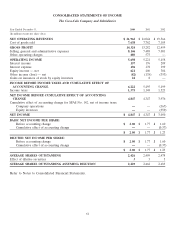
Exchange gains (losses)—net amounted to $(39) million in 2004, $(76) million in 2003 and $(118) million in
2002 and were recorded in other income (loss)—net in our consolidated statements of income. Exchange gains
(losses)—net include the remeasurement of monetary assets and liabilities from certain currencies into
functional currencies and the costs of hedging certain exposures of our consolidated balance sheets.
Refer to Note 10.
Overview of Financial Position
Our consolidated balance sheet as of December 31, 2004, compared to our consolidated balance sheet as of
December 31, 2003, was impacted by the following:
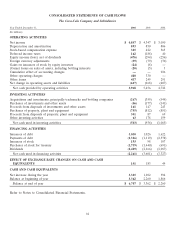
• The increase in cash and cash equivalents of $3,345 million was due primarily to net cash provided by
operating activities of $5,968 million in 2004. A significant portion of this cash was generated in locations
outside the United States and the majority of our cash balances are held in locations outside the United
States. As a result of the Jobs Creation Act, the Company has elected to maintain significant cash
balances at its international locations (principally in Ireland) while the Company evaluates the potential
impact of the tax legislation. Refer to Note 15.
• The increase in loans and notes payable of $1,948 million was due to the issuance of commercial paper
during 2004 to meet short-term cash needs in the United States, including the quarterly dividend
payments and repurchases of common stock.
• The increase in our equity method investments in 2004 of $673 million was primarily due to the impact of
the strength in most key currencies versus the U.S. dollar and an increase of 2004 equity income, net of
dividends. Refer to Note 2.
• The increase in buildings and improvements of approximately $238 million and machinery and equipment
of approximately $178 million was primarily due to positive currency translation adjustments, offset by
the sale of production assets in Japan with a carrying value of $271 million. Refer to Note 2.
• The overall increase in total assets as of December 31, 2004, compared to December 31, 2003, was
primarily related to the increase in cash and cash equivalents mentioned above, which impacted the
Corporate operating segment, and the impact of the strength in most key currencies versus the U.S.
54