Coca Cola 2004 Annual Report Download - page 57
Download and view the complete annual report
Please find page 57 of the 2004 Coca Cola annual report below. You can navigate through the pages in the report by either clicking on the pages listed below, or by using the keyword search tool below to find specific information within the annual report.-
 1
1 -
2
-
3
-
4
-
5
-
6
-
7
-
8
-
9
-
10
-
11
-
12
-
13
-
14
-
15
-
16
-
17
-
18
-
19
-
20
-
21
-
22
-
23
-
24
-
25
-
26
-
27
-
28
-
29
-
30
-
31
-
32
-
33
-
34
-
35
-
36
-
37
-
38
-
39
-
40
-
41
-
42
-
43
-
44
-
45
-
46
-
 47
47 -
 48
48 -
 49
49 -
 50
50 -
 51
51 -
 52
52 -
 53
53 -
 54
54 -
 55
55 -
 56
56 -
 57
57 -
 58
58 -
 59
59 -
 60
60 -
 61
61 -
 62
62 -
 63
63 -
 64
64 -
 65
65 -
 66
66 -
 67
67 -
68
-
69
-
70
-
71
-
72
-
73
-
74
-
75
-
76
-
77
-
78
-
79
-
80
-
81
-
82
-
83
-
84
-
85
-
86
-
87
-
88
-
89
-
90
-
91
-
92
-
93
-
94
-
95
-
96
-
97
-
98
-
99
-
100
-
101
-
102
-
103
-
104
-
105
-
106
-
107
-
108
-
109
-
110
-
111
-
112
-
113
-
114
-
115
-
116
-
117
-
118
-
119
-
120
-
121
-
122
-
123
-
124
-
125
-
126
-
127
-
128
-
129
-
130
-
131
-
132
-
133
-
134
-
135
-
136
-
137
-
138
-
139
-
140
 |
 |

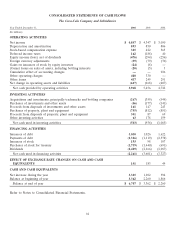
dollar, especially a stronger euro (that impacted our Europe, Eurasia and Middle East operating
segment) and a stronger Japanese yen (that impacted our Asia operating segment), partially offset by
$480 million primarily related to impairment charges for franchise rights and manufacturing investments
and the sale of production assets in Japan. Refer to the heading ‘‘Other Operating Charges’’ for a
discussion of the impairment charges.
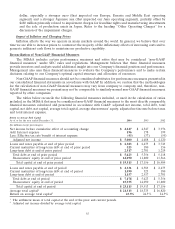
Impact of Inflation and Changing Prices
Inflation affects the way we operate in many markets around the world. In general, we believe that over
time we are able to increase prices to counteract the majority of the inflationary effects of increasing costs and to
generate sufficient cash flows to maintain our productive capability.
Reconciliation of Non-GAAP Financial Measures
The MD&A includes certain performance measures and ratios that may be considered ‘‘non-GAAP
financial measures’’ under SEC rules and regulations. Management believes that these financial measures
provide investors and analysts useful additional insight into our Company’s financial position and performance.
Management also uses these financial measures to evaluate the Company’s performance and to make certain
decisions relating to our Company’s optimal capital structure and allocation of resources.
Non-GAAP financial measures should not be considered substitutes for performance measures presented in
our consolidated financial statements in accordance with GAAP. In addition, we caution that the methodologies
for the calculation of non-GAAP financial measures may vary from company to company and, therefore, non-
GAAP financial measures we present may not be comparable to similarly-named non-GAAP financial measures
reported by other companies.
The tables below reconcile the following financial measures included, or used in the calculation of ratios
included, in the MD&A that may be considered non-GAAP financial measures to the most directly comparable
financial measures calculated and presented in accordance with GAAP: adjusted net income, total debt, total
capital, net debt, net capital, average total capital, average shareowners’ equity, adjusted net income before taxes
and total interest expense.
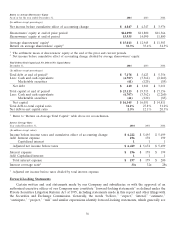
Return on Average Total Capital
As of or for the year ended December 31, 2004 2003 2002
(In millions except percentages)
Net income before cumulative effect of accounting change $ 4,847 $ 4,347 $ 3,976
Add: Interest expense 196 178 199
Less: Effective tax rate benefit of interest expense (43) (37) (55)
Adjusted net income $ 5,000 $ 4,488 $ 4,120
Loans and notes payable at end of prior period $ 2,583 $ 2,475 $ 3,743
Current maturities of long-term debt at end of prior period 323 180 156
Long-term debt at end of prior period 2,517 2,701 1,219
Total debt at end of prior period $ 5,423 $ 5,356 $ 5,118
Shareowners’ equity at end of prior period 14,090 11,800 11,366
Total capital at end of prior period $ 19,513 $ 17,156 $ 16,484
Loans and notes payable at end of period $ 4,531 $ 2,583 $ 2,475
Current maturities of long-term debt at end of period 1,490 323 180
Long-term debt at end of period 1,157 2,517 2,701
Total debt at end of period $ 7,178 $ 5,423 $ 5,356
Shareowners’ equity at end of period 15,935 14,090 11,800
Total capital at end of period $ 23,113 $ 19,513 $ 17,156
Average total capital1$ 21,313 $ 18,335 $ 16,820
Return on average total capital223.5% 24.5% 24.5%
1The arithmetic mean of total capital at the end of the prior and current periods.
2Adjusted net income divided by average total capital.
55