Coca Cola 2004 Annual Report Download - page 29
Download and view the complete annual report
Please find page 29 of the 2004 Coca Cola annual report below. You can navigate through the pages in the report by either clicking on the pages listed below, or by using the keyword search tool below to find specific information within the annual report.-
 1
1 -
2
-
3
-
4
-
5
-
6
-
7
-
8
-
9
-
10
-
11
-
12
-
13
-
14
-
15
-
16
-
17
-
18
-
 19
19 -
 20
20 -
 21
21 -
 22
22 -
 23
23 -
 24
24 -
 25
25 -
 26
26 -
 27
27 -
 28
28 -
 29
29 -
 30
30 -
 31
31 -
 32
32 -
 33
33 -
 34
34 -
 35
35 -
 36
36 -
 37
37 -
 38
38 -
 39
39 -
40
-
41
-
42
-
43
-
44
-
45
-
46
-
47
-
48
-
49
-
50
-
51
-
52
-
53
-
54
-
55
-
56
-
57
-
58
-
59
-
60
-
61
-
62
-
63
-
64
-
65
-
66
-
67
-
68
-
69
-
70
-
71
-
72
-
73
-
74
-
75
-
76
-
77
-
78
-
79
-
80
-
81
-
82
-
83
-
84
-
85
-
86
-
87
-
88
-
89
-
90
-
91
-
92
-
93
-
94
-
95
-
96
-
97
-
98
-
99
-
100
-
101
-
102
-
103
-
104
-
105
-
106
-
107
-
108
-
109
-
110
-
111
-
112
-
113
-
114
-
115
-
116
-
117
-
118
-
119
-
120
-
121
-
122
-
123
-
124
-
125
-
126
-
127
-
128
-
129
-
130
-
131
-
132
-
133
-
134
-
135
-
136
-
137
-
138
-
139
-
140
 |
 |

provide more alternatives to consumers. With this expansion and growth, our Company is focused on
maintaining or increasing profit margins. We further intend to focus on improving margins in faster growing but
lower-margin countries. To manage this expansion and growth, we have shifted from a volume focus to a
‘‘volume and value’’ focus. We believe that tailored brand, package, price and channel strategies help achieve
profitable growth. We are implementing these strategies to accelerate profitable growth through close alignment
with our bottling partners.
Leveraging Operating and Marketing Investments. We intend to drive increased efficiency by leveraging our
operating and marketing investments. A principal focus to achieve this leverage will continue to be efficiency in
the supply chain. In 2003, our Company and our bottling partners established supply chain management
companies to help increase procurement efficiencies and centralize production and logistics operations in North
America, Japan and China. In 2004, the Coca-Cola system began to realize some of the benefits from these
initiatives. Lowering supply chain costs improves system economics. Alignment with our bottling partners on
ways to achieve additional joint savings represents a critical area of focus for 2005 and beyond. In the future, our
Company, together with our bottling partners, will continue to look for opportunities to leverage expenses by
working to reduce duplication of efforts, consolidating operations, increasing in-market execution, simplifying
the decision making process and increasing our speed to market.
Efficient Capital Structure. Our capital structure is intended to optimize our cost of capital. We believe our
strong capital position, our access to key financial markets, our ability to raise funds at a low effective cost and
our overall low cost of borrowing provide a competitive advantage.
As our cash flow increases, we expect to increase our share repurchases. Furthermore, the dividend rate
increased for the 43rd straight year in 2005, and we believe that for the foreseeable future, our Board of
Directors intends to increase our dividends. Refer to the heading ‘‘Financial Strategies and Risk Management.’’
Measurements of Financial Performance
We believe these value drivers, when properly leveraged, will result in (1) maintaining or improving our
gross profit margin; (2) providing additional leverage over time through reduced expenses as a percentage of net
operating revenues; and (3) optimizing our cost of capital. The ultimate measure of our success will be reflected
in results of operations, liquidity and capital resources.
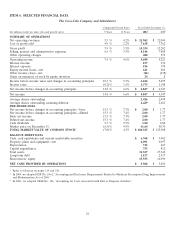
Results of Operations. Net operating revenues, gross profit, operating income, income before income taxes
and net income per share are key measurements of our operating performance. In 2004, net operating revenues
totaled approximately $22.0 billion, a 4 percent increase from 2003. Gross profit totaled approximately
$14.3 billion in 2004, an 8 percent increase from 2003. Operating income was approximately $5.7 billion, a
9 percent increase from 2003. Income before income taxes was approximately $6.2 billion, a 13 percent increase
from 2003. Net income per share (basic and diluted) was $2.00 for 2004, a 13 percent increase from 2003. These
measurements will continue to be a key management focus in 2005 and beyond. Refer to the heading
‘‘Operations Review.’’
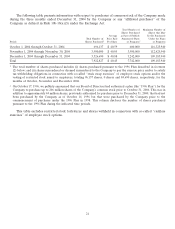
Liquidity and Capital Resources. In 2004, our net cash provided by operating activities was approximately
$6.0 billion, a 9 percent increase from 2003. For years 2005 through 2009, we expect our cumulative net cash
provided by operating activities to be in excess of $30 billion. We believe this is one of our Company’s
strengths—the ability to generate significant cash flows to reinvest in our business. We utilize our cash in ways
that the Board of Directors and management believe provide the greatest shareowner value. Principal uses of
our cash flows are:
•Share repurchases. In 2004, share repurchases were approximately $1.7 billion, and we expect 2005 share
repurchases to be at least $2.0 billion.
•Dividends. In 2004, dividends were approximately $2.4 billion, and we anticipate that the total dividends
paid will again increase in 2005.
27