Coca Cola 2004 Annual Report Download - page 50
Download and view the complete annual report
Please find page 50 of the 2004 Coca Cola annual report below. You can navigate through the pages in the report by either clicking on the pages listed below, or by using the keyword search tool below to find specific information within the annual report.-
 1
1 -
2
-
3
-
4
-
5
-
6
-
7
-
8
-
9
-
10
-
11
-
12
-
13
-
14
-
15
-
16
-
17
-
18
-
19
-
20
-
21
-
22
-
23
-
24
-
25
-
26
-
27
-
28
-
29
-
30
-
31
-
32
-
33
-
34
-
35
-
36
-
37
-
38
-
39
-
 40
40 -
 41
41 -
 42
42 -
 43
43 -
 44
44 -
 45
45 -
 46
46 -
 47
47 -
 48
48 -
 49
49 -
 50
50 -
 51
51 -
 52
52 -
 53
53 -
 54
54 -
 55
55 -
 56
56 -
 57
57 -
 58
58 -
 59
59 -
 60
60 -
61
-
62
-
63
-
64
-
65
-
66
-
67
-
68
-
69
-
70
-
71
-
72
-
73
-
74
-
75
-
76
-
77
-
78
-
79
-
80
-
81
-
82
-
83
-
84
-
85
-
86
-
87
-
88
-
89
-
90
-
91
-
92
-
93
-
94
-
95
-
96
-
97
-
98
-
99
-
100
-
101
-
102
-
103
-
104
-
105
-
106
-
107
-
108
-
109
-
110
-
111
-
112
-
113
-
114
-
115
-
116
-
117
-
118
-
119
-
120
-
121
-
122
-
123
-
124
-
125
-
126
-
127
-
128
-
129
-
130
-
131
-
132
-
133
-
134
-
135
-
136
-
137
-
138
-
139
-
140
 |
 |

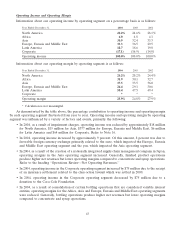
The Africa operating segment’s unit case volume increased by 5 percent in 2003 compared to 2002, mainly
driven by strong growth in South Africa. Trademark Coca-Cola increased by 11 percent during the year in South
Africa as a result of continued rollout of the ‘‘Real’’ campaign, a successful summer promotion and strong
marketplace execution. In the North and West Africa Division, unit case volume increased by 6 percent, led by
strong growth in Morocco and Cameroon, and the expansion into new markets.
In the Asia operating segment, unit case volume increased by 4 percent in 2003 compared to 2002,
reflecting the short-term negative impact of Severe Acute Respiratory Syndrome (‘‘SARS’’) and negative
publicity related to allegations of a pesticide issue in India. In China, unit case volume increased by 16 percent,
as the Company adapted quickly to the SARS crisis and achieved double-digit growth for both carbonated soft
drinks and noncarbonated beverages. In Japan, unit case volume declined by 3 percent due to poor weather
conditions during the key summer months, which impacted the entire beverage industry. In India, unit case
volume increased by 22 percent in 2003 due to the Company’s successful affordability strategy and diverse
product offering.
Unit case volume in the Europe, Eurasia and Middle East operating segment increased by 5 percent in 2003
compared to 2002. The Italy and Alpine Division grew unit case volume by 11 percent, led by Italy where the
Company focused on building the immediate consumption business by revitalizing brand Coca-Cola. In the
Eurasia and Middle East Division, unit case volume increased by 9 percent led by Turkey, where a total beverage
strategy has been implemented successfully.
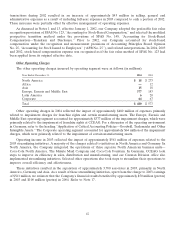
Unit case volume for the Latin America operating segment increased by 4 percent in 2003 compared to
2002. Mexico unit case volume increased by 10 percent during the year, reflecting carbonated soft drink growth
of 3 percent, resulting from packaging innovations, new flavor introductions and the effect of the ‘‘Real’’
marketing platform. In Argentina, unit case volume increased by 13 percent during 2003, driven by Trademark
Coca-Cola increasing by 19 percent. In Brazil, unit case volume declined by 6 percent during the year as a result
of both weak economic conditions and the greater focus on balancing volume growth with margin expansion.
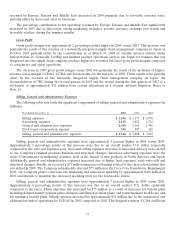
Liquidity, Capital Resources and Financial Position
We believe our ability to generate cash from operations is one of our fundamental financial strengths. We
expect cash flows from operations to be strong in 2005 and in future years. For the five-year period from 2005
through 2009, we currently estimate that cumulative net cash provided by operating activities will be in excess of
$30 billion. Accordingly, our Company expects to meet all our financial commitments and operating needs
during this time frame. We expect to use cash generated from operating activities primarily for dividends, share
repurchases, acquisitions and aggregate contractual obligations.
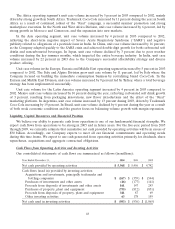
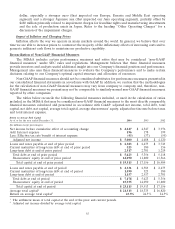
Cash Flows from Operating Activities and Investing Activities
Our consolidated statements of cash flows are summarized as follows (in millions):
Year Ended December 31, 2004 2003 2002
Net cash provided by operating activities $ 5,968 $ 5,456 $ 4,742
Cash flows (used in) provided by investing activities:
Acquisitions and investments, principally trademarks and
bottling companies $ (267) $ (359) $ (544)
Purchases of investments and other assets (46) (177) (141)
Proceeds from disposals of investments and other assets 161 147 243
Purchases of property, plant and equipment (755) (812) (851)
Proceeds from disposals of property, plant and equipment 341 87 69
Other investing activities 63 178 159
Net cash used in investing activities $ (503) $ (936) $ (1,065)
48