Coca Cola 2004 Annual Report Download - page 49
Download and view the complete annual report
Please find page 49 of the 2004 Coca Cola annual report below. You can navigate through the pages in the report by either clicking on the pages listed below, or by using the keyword search tool below to find specific information within the annual report.-
 1
1 -
2
-
3
-
4
-
5
-
6
-
7
-
8
-
9
-
10
-
11
-
12
-
13
-
14
-
15
-
16
-
17
-
18
-
19
-
20
-
21
-
22
-
23
-
24
-
25
-
26
-
27
-
28
-
29
-
30
-
31
-
32
-
33
-
34
-
35
-
36
-
37
-
38
-
 39
39 -
 40
40 -
 41
41 -
 42
42 -
 43
43 -
 44
44 -
 45
45 -
 46
46 -
 47
47 -
 48
48 -
 49
49 -
 50
50 -
 51
51 -
 52
52 -
 53
53 -
 54
54 -
 55
55 -
 56
56 -
 57
57 -
 58
58 -
 59
59 -
60
-
61
-
62
-
63
-
64
-
65
-
66
-
67
-
68
-
69
-
70
-
71
-
72
-
73
-
74
-
75
-
76
-
77
-
78
-
79
-
80
-
81
-
82
-
83
-
84
-
85
-
86
-
87
-
88
-
89
-
90
-
91
-
92
-
93
-
94
-
95
-
96
-
97
-
98
-
99
-
100
-
101
-
102
-
103
-
104
-
105
-
106
-
107
-
108
-
109
-
110
-
111
-
112
-
113
-
114
-
115
-
116
-
117
-
118
-
119
-
120
-
121
-
122
-
123
-
124
-
125
-
126
-
127
-
128
-
129
-
130
-
131
-
132
-
133
-
134
-
135
-
136
-
137
-
138
-
139
-
140
 |
 |

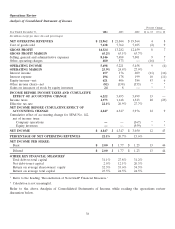
point changes, timing of price increases and new product introductions can create differences between gallon
sales and unit case volume.
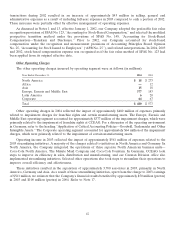
Although most of our Company’s revenues are not based directly on unit case volume, we believe unit case
volume is one of the measures of the underlying strength of the Coca-Cola system because it measures trends at
the consumer level. The Coca-Cola system sold approximately 19.8 billion unit cases of our products in 2004 and
approximately 19.4 billion unit cases in 2003. Approximate 2004 and 2003 unit case volume growth results are
as follows:
Percentage Change
2004 vs. 2003 2003 vs. 2002
Worldwide 2 4
North America operations 0 2
International operations—total 3 5
Africa 3 5
Asia 54
Europe, Eurasia and Middle East 0 5
Latin America 3 4
In the North America operating segment, unit case volume for 2004 was even compared to 2003. The Retail
Division had a 1 percent decrease in unit case volume in 2004 versus 2003, primarily due to poor weather in the
third quarter, higher retail pricing and lower than expected results from Coca-Cola C2. The Foodservice and
Hospitality Division’s unit case volume increased 2 percent as a result of effective customer programs and
improved restaurant traffic.
In the Africa operating segment, unit case volume increased by 3 percent in 2004 compared to 2003,
primarily as a result of the growth in South Africa, where unit case volume increased by 7 percent and Morocco
and Kenya. This increase was partially offset by volume declines in Nigeria due to de-emphasis on less-profitable
water packages and weakness in noncore brands and Egypt.
In the Asia operating segment, unit case volume increased by 5 percent in 2004 versus 2003, primarily led by
a 22 percent growth in China as a result of a new advertising campaign, innovative packaging and promotion in
the cities, and affordable 200ml packaging in the towns. Japan growth of 4 percent was driven by Trademark
Coca-Cola unit case volume growth of 3 percent and trademark Fanta growth of 17 percent. These increases
were offset by an 8 percent decline in the Philippines due to affordability and availability issues.
Unit case volume in the Europe, Eurasia and Middle East operating segment was even in 2004 versus 2003,
primarily due to limited brand and package availability in the discount retail channel in Germany and poor
weather conditions in northern Europe, partially offset by successful promotions and continued positive
economic trends in Turkey, Russia and the Middle East.
Unit case volume for the Latin America operating segment increased by 3 percent in 2004 versus 2003,
primarily reflecting strong growth in Brazil, Argentina and Venezuela resulting from the execution of the
Company’s long-term investment strategy with an emphasis on brand building, new package alternatives and
close coordination with bottling partners to drive superior local marketplace execution offset by de-emphasis on
large format water and powdered drinks in Mexico.
In the North America operating segment, unit case volume increased by 2 percent in 2003 compared to
2002 driven by strong contributions from the Diet Coke brands and the national rollout of the Fridge Pack. In
addition, performance in the Foodservice and Hospitality Division steadily improved throughout the year as
economic conditions and restaurant traffic improved. Further, unit case volume for trademark Sprite increased
by 7 percent, POWERade by 21 percent and Dasani by 16 percent during 2003.
47