Coca Cola 2004 Annual Report Download - page 41
Download and view the complete annual report
Please find page 41 of the 2004 Coca Cola annual report below. You can navigate through the pages in the report by either clicking on the pages listed below, or by using the keyword search tool below to find specific information within the annual report.-
 1
1 -
2
-
3
-
4
-
5
-
6
-
7
-
8
-
9
-
10
-
11
-
12
-
13
-
14
-
15
-
16
-
17
-
18
-
19
-
20
-
21
-
22
-
23
-
24
-
25
-
26
-
27
-
28
-
29
-
30
-
 31
31 -
 32
32 -
 33
33 -
 34
34 -
 35
35 -
 36
36 -
 37
37 -
 38
38 -
 39
39 -
 40
40 -
 41
41 -
 42
42 -
 43
43 -
 44
44 -
 45
45 -
 46
46 -
 47
47 -
 48
48 -
 49
49 -
 50
50 -
 51
51 -
52
-
53
-
54
-
55
-
56
-
57
-
58
-
59
-
60
-
61
-
62
-
63
-
64
-
65
-
66
-
67
-
68
-
69
-
70
-
71
-
72
-
73
-
74
-
75
-
76
-
77
-
78
-
79
-
80
-
81
-
82
-
83
-
84
-
85
-
86
-
87
-
88
-
89
-
90
-
91
-
92
-
93
-
94
-
95
-
96
-
97
-
98
-
99
-
100
-
101
-
102
-
103
-
104
-
105
-
106
-
107
-
108
-
109
-
110
-
111
-
112
-
113
-
114
-
115
-
116
-
117
-
118
-
119
-
120
-
121
-
122
-
123
-
124
-
125
-
126
-
127
-
128
-
129
-
130
-
131
-
132
-
133
-
134
-
135
-
136
-
137
-
138
-
139
-
140
 |
 |

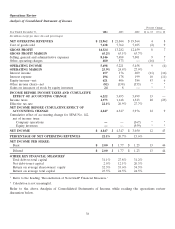
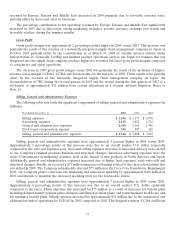
Net Operating Revenues
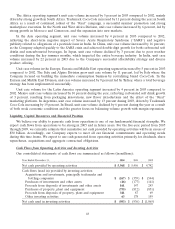
Net operating revenues increased by $918 million in 2004 versus 2003. Net operating revenues increased by
$1,480 million in 2003 versus 2002.
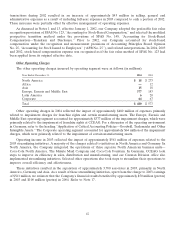
The following table indicates, on a percentage basis, the estimated impact of key factors resulting in
significant increases (decreases) in net operating revenues:
Percent Change
2004 vs. 2003 2003 vs. 2002
Increase in gallon sales, including acquisitions 2% 3%
Structural changes (3) (1)
Price and product/geographic mix 0 1
Impact of currency fluctuations versus the U.S. dollar 5 5
Total percentage increase 4% 8%
Our gallon sales increased by 2 percent in 2004 primarily due to a 3 percent increase in Asia, a 4 percent
increase in Africa and a 3 percent increase in Latin America. North America gallon sales increased by 2 percent
as the Foodservice and Hospitality Division grew by 4 percent and the Retail Division increased by 1 percent.
Europe was even as growth in Turkey, Russia and Spain was offset by declines in Germany. The decrease in
Germany was primarily the result of market shifts related to the deposit law on non-refillable beverage packages
and the corresponding lack of availability of our products in the discount retail channel. For a discussion of the
operating environment in Germany, refer to the heading ‘‘Application of Critical Accounting Policies—
Goodwill, Trademarks and Other Intangible Assets.’’ Our Company is evaluating our strategies for the German
operations, including addressing significant structural issues that limit the system’s ability to respond effectively
to the evolving retail and consumer landscape, assessing market changes and determining our expectations
related to the political environment. We expect the German market environment to remain difficult throughout
2005. We will continue to focus on improving our short-term performance and strengthening our system’s
long-term capabilities.
Company-wide gallon sales growth of 2 percent was in line with unit case volume growth. However, in North
America, gallon sales increased by 2 percent in 2004 compared to 2003 while unit case volume was flat in 2004 due
to lower gallon sales in 2003, additional 2004 shipments related to new product introductions, changes in our
shipping routes and higher than expected year end sales. Gallon sales in Asia were 2 percent behind unit case
volume due to structural changes that took place in 2003 (see discussion below). Gallon sales and unit case volume
are not necessarily equal during any given period. Items such as seasonality, bottlers’ inventory practices, supply
point changes, timing of price increases and new product introductions can create differences between gallon sales
and unit case volume. For a more detailed discussion on unit case volume, refer to the heading ‘‘Volume.’’
‘‘Structural changes’’ refers to acquisitions or dispositions of bottling or canning operations, and
consolidation or deconsolidation of entities for accounting purposes. Effective October 1, 2003, the Company
and all of our bottling partners in Japan created a nationally integrated supply chain management company to
centralize procurement, production and logistics operations for the entire Coca-Cola system in Japan. As a
result, a portion of our Company’s business has essentially been converted from a finished product business
model to a concentrate business model. This shift of certain products to a concentrate business model resulted in
reductions in our revenues and cost of goods sold, each in the same amount. This change in the business model
did not impact gross profit. The decrease in net revenues from 2003 to 2004 attributable to the Japan structural
change was approximately $780 million, which was partially offset by an approximately $260 million increase in
revenues associated with the consolidation as of March 31, 2004 of certain bottling operations that are
considered variable interest entities. Refer to Note 1.
39