Coca Cola 2004 Annual Report Download - page 45
Download and view the complete annual report
Please find page 45 of the 2004 Coca Cola annual report below. You can navigate through the pages in the report by either clicking on the pages listed below, or by using the keyword search tool below to find specific information within the annual report.-
 1
1 -
2
-
3
-
4
-
5
-
6
-
7
-
8
-
9
-
10
-
11
-
12
-
13
-
14
-
15
-
16
-
17
-
18
-
19
-
20
-
21
-
22
-
23
-
24
-
25
-
26
-
27
-
28
-
29
-
30
-
31
-
32
-
33
-
34
-
 35
35 -
 36
36 -
 37
37 -
 38
38 -
 39
39 -
 40
40 -
 41
41 -
 42
42 -
 43
43 -
 44
44 -
 45
45 -
 46
46 -
 47
47 -
 48
48 -
 49
49 -
 50
50 -
 51
51 -
 52
52 -
 53
53 -
 54
54 -
 55
55 -
56
-
57
-
58
-
59
-
60
-
61
-
62
-
63
-
64
-
65
-
66
-
67
-
68
-
69
-
70
-
71
-
72
-
73
-
74
-
75
-
76
-
77
-
78
-
79
-
80
-
81
-
82
-
83
-
84
-
85
-
86
-
87
-
88
-
89
-
90
-
91
-
92
-
93
-
94
-
95
-
96
-
97
-
98
-
99
-
100
-
101
-
102
-
103
-
104
-
105
-
106
-
107
-
108
-
109
-
110
-
111
-
112
-
113
-
114
-
115
-
116
-
117
-
118
-
119
-
120
-
121
-
122
-
123
-
124
-
125
-
126
-
127
-
128
-
129
-
130
-
131
-
132
-
133
-
134
-
135
-
136
-
137
-
138
-
139
-
140
 |
 |

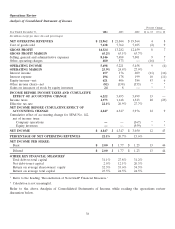
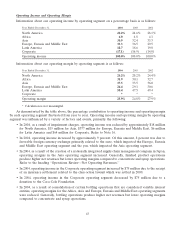
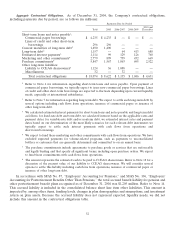
Operating Income and Operating Margin
Information about our operating income by operating segment on a percentage basis is as follows:
Year Ended December 31, 2004 2003 2002
North America 28.2% 24.6% 28.1%
Africa 6.0 4.8 4.1
Asia 30.9 32.4 33.3
Europe, Eurasia and Middle East 33.3 36.5 29.5
Latin America 18.7 18.6 19.0
Corporate (17.1) (16.9) (14.0)
Operating income 100.0% 100.0% 100.0%
Information about our operating margin by operating segment is as follows:
Year Ended December 31, 2004 2003 2002
North America 24.2% 20.2% 24.4%
Africa 31.9 30.1 32.7
Asia 37.5 33.5 36.0
Europe, Eurasia and Middle East 26.4 29.1 30.6
Latin America 50.4 47.5 49.4
Corporate ***
Operating margin 25.9% 24.8% 27.9%
* Calculation is not meaningful.
As demonstrated by the table above, the percentage contribution to operating income and operating margin
by each operating segment fluctuated from year to year. Operating income and operating margin by operating
segment was influenced by a variety of factors and events, primarily the following:
• In 2004, as a result of impairment charges, operating income was reduced by approximately $18 million
for North America, $15 million for Asia, $377 million for Europe, Eurasia and Middle East, $6 million
for Latin America and $64 million for Corporate. Refer to Note 16.
• In 2004, operating income increased by approximately 9 percent. Of this amount, 8 percent was due to
favorable foreign currency exchange primarily related to the euro, which impacted the Europe, Eurasia
and Middle East operating segment and the yen, which impacted the Asia operating segment.
• In 2004, as a result of the creation of a nationally integrated supply chain management company in Japan,
operating margins in the Asia operating segment increased. Generally, finished product operations
produce higher net revenues but lower operating margins compared to concentrate and syrup operations.
Refer to the heading ‘‘Operations Review—Net Operating Revenues.’’
• In 2004, operating income in the Corporate operating segment increased by $75 million due to the receipt
of an insurance settlement related to the class-action lawsuit which was settled in 2000.
• In 2004, operating income in the Corporate operating segment decreased by $75 million due to a
donation to the Coca-Cola Foundation.
• In 2004, as a result of consolidation of certain bottling operations that are considered variable interest
entities, operating margins for the Africa, Asia and Europe, Eurasia and Middle East operating segments
were reduced. Generally, bottling operations produce higher net revenues but lower operating margins
compared to concentrate and syrup operations.
43