Coca Cola 2004 Annual Report Download - page 43
Download and view the complete annual report
Please find page 43 of the 2004 Coca Cola annual report below. You can navigate through the pages in the report by either clicking on the pages listed below, or by using the keyword search tool below to find specific information within the annual report.-
 1
1 -
2
-
3
-
4
-
5
-
6
-
7
-
8
-
9
-
10
-
11
-
12
-
13
-
14
-
15
-
16
-
17
-
18
-
19
-
20
-
21
-
22
-
23
-
24
-
25
-
26
-
27
-
28
-
29
-
30
-
31
-
32
-
 33
33 -
 34
34 -
 35
35 -
 36
36 -
 37
37 -
 38
38 -
 39
39 -
 40
40 -
 41
41 -
 42
42 -
 43
43 -
 44
44 -
 45
45 -
 46
46 -
 47
47 -
 48
48 -
 49
49 -
 50
50 -
 51
51 -
 52
52 -
 53
53 -
54
-
55
-
56
-
57
-
58
-
59
-
60
-
61
-
62
-
63
-
64
-
65
-
66
-
67
-
68
-
69
-
70
-
71
-
72
-
73
-
74
-
75
-
76
-
77
-
78
-
79
-
80
-
81
-
82
-
83
-
84
-
85
-
86
-
87
-
88
-
89
-
90
-
91
-
92
-
93
-
94
-
95
-
96
-
97
-
98
-
99
-
100
-
101
-
102
-
103
-
104
-
105
-
106
-
107
-
108
-
109
-
110
-
111
-
112
-
113
-
114
-
115
-
116
-
117
-
118
-
119
-
120
-
121
-
122
-
123
-
124
-
125
-
126
-
127
-
128
-
129
-
130
-
131
-
132
-
133
-
134
-
135
-
136
-
137
-
138
-
139
-
140
 |
 |

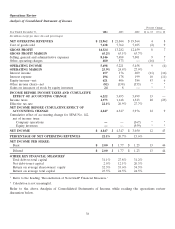
revenues by Europe, Eurasia and Middle East increased in 2004 primarily due to favorable currency rates,
partially offset by decreased sales in Germany.
The percentage contribution to net operating revenues by Europe, Eurasia and Middle East significantly
increased in 2003 due to innovation, strong marketing strategies, positive currency exchange rate trends and
favorable weather during the summer months.
Gross Profit
Gross profit margin was approximately 2 percentage points higher in 2004 versus 2003. This increase was
primarily the result of the creation of a nationally integrated supply chain management company in Japan in
October 2003 partially offset by the consolidation as of March 31, 2004 of variable interest entities under
Interpretation 46. Generally, bottling and finished product operations, such as our Japan tea business that was
integrated into the supply chain company, produce higher net revenues but lower gross profit margins compared
to concentrate and syrup operations.
The decrease in 2003 gross profit margin versus 2002 was primarily the result of the inclusion of higher-
revenue, lower-margin CCEAG, CCDA and Evian results for the full year of 2003. These results were partially
offset by the creation of the nationally integrated supply chain management company in Japan, the
deconsolidation of CBC during the second quarter of 2003 and the receipt during the first quarter of 2003 of a
settlement of approximately $52 million from certain defendants in a vitamin antitrust litigation. Refer to
Note 16.
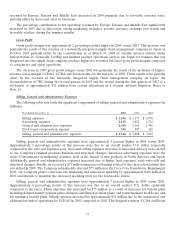
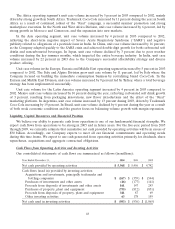
Selling, General and Administrative Expenses
The following table sets forth the significant components of selling, general and administrative expenses (in
millions):
Year Ended December 31, 2004 2003 2002
Selling expenses $ 3,296 $ 3,157 $ 2,978
Advertising expenses 2,165 1,822 1,712
General and administrative expenses 2,340 2,102 1,946
Stock-based compensation expense 345 407 365
Selling, general and administrative expenses $ 8,146 $ 7,488 $ 7,001
Selling, general and administrative expenses were approximately 9 percent higher in 2004 versus 2003.
Approximately 3 percentage points of this increase were due to an overall weaker U.S. dollar (especially
compared to the euro and Japanese yen). Increased selling expenses were due to increased delivery costs related
to our Company’s finished products business and structural changes. Increased advertising expenses were the
result of investments in marketing activities, such as the launch of new products in North America and Japan.
Additionally, general and administrative expenses increased due to higher legal expenses, asset write-offs and
structural changes. Finally, we received a $75 million insurance settlement related to the class-action lawsuit that
was settled in 2000. The Company subsequently donated $75 million to the Coca-Cola Foundation. Beginning in
2005, our Company plans to increase our marketing and innovation spending by approximately $400 million in
2005 and intends to maintain the increased spending level for the foreseeable future.
Selling, general and administrative expenses were approximately 7 percent higher in 2003 versus 2002.
Approximately 4 percentage points of this increase was due to an overall weaker U.S. dollar (primarily
compared to the euro). These expenses also increased by $75 million as a result of increases for benefit plans
including defined benefit pension plans, defined contribution pension plans, and postretirement health care and
life insurance benefit plans. Selling expenses increased by approximately $32 million due to the inclusion of one
additional month of operations for CCEAG in 2003 compared to 2002. The Seagram’s mixers, CCDA and Evian
41