Coca Cola 2004 Annual Report Download - page 24
Download and view the complete annual report
Please find page 24 of the 2004 Coca Cola annual report below. You can navigate through the pages in the report by either clicking on the pages listed below, or by using the keyword search tool below to find specific information within the annual report.-
 1
1 -
2
-
3
-
4
-
5
-
6
-
7
-
8
-
9
-
10
-
11
-
12
-
13
-
 14
14 -
 15
15 -
 16
16 -
 17
17 -
 18
18 -
 19
19 -
 20
20 -
 21
21 -
 22
22 -
 23
23 -
 24
24 -
 25
25 -
 26
26 -
 27
27 -
 28
28 -
 29
29 -
 30
30 -
 31
31 -
 32
32 -
 33
33 -
 34
34 -
35
-
36
-
37
-
38
-
39
-
40
-
41
-
42
-
43
-
44
-
45
-
46
-
47
-
48
-
49
-
50
-
51
-
52
-
53
-
54
-
55
-
56
-
57
-
58
-
59
-
60
-
61
-
62
-
63
-
64
-
65
-
66
-
67
-
68
-
69
-
70
-
71
-
72
-
73
-
74
-
75
-
76
-
77
-
78
-
79
-
80
-
81
-
82
-
83
-
84
-
85
-
86
-
87
-
88
-
89
-
90
-
91
-
92
-
93
-
94
-
95
-
96
-
97
-
98
-
99
-
100
-
101
-
102
-
103
-
104
-
105
-
106
-
107
-
108
-
109
-
110
-
111
-
112
-
113
-
114
-
115
-
116
-
117
-
118
-
119
-
120
-
121
-
122
-
123
-
124
-
125
-
126
-
127
-
128
-
129
-
130
-
131
-
132
-
133
-
134
-
135
-
136
-
137
-
138
-
139
-
140
 |
 |

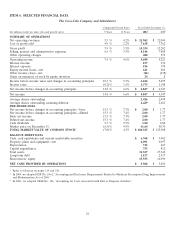
ITEM 6. SELECTED FINANCIAL DATA
The Coca-Cola Company and Subsidiaries
Compound Growth Rates Year Ended December 31,
(In millions except per share data and growth rates) 5 Years 10 Years 2004220033
SUMMARY OF OPERATIONS
Net operating revenues 5.5 % 4.2% $ 21,962 $ 21,044
Cost of goods sold 4.9 % 2.2% 7,638 7,762
Gross profit 5.9 % 5.5% 14,324 13,282
Selling, general and administrative expenses 6.4 % 5.5% 8,146 7,488
Other operating charges 480 573
Operating income 7.4 % 4.6% 5,698 5,221
Interest income 157 176
Interest expense 196 178
Equity income (loss)—net 621 406
Other income (loss)—net (82) (138)
Gains on issuances of stock by equity investees 24 8
Income before income taxes and changes in accounting principles 10.3 % 5.3% 6,222 5,495
Income taxes (0.2)% 1.6% 1,375 1,148
Net income before changes in accounting principles 14.8 % 6.6% $ 4,847 $ 4,347
Net income 14.8 % 6.6% $ 4,847 $ 4,347
Average shares outstanding 2,426 2,459
Average shares outstanding assuming dilution 2,429 2,462
PER SHARE DATA
Net income before changes in accounting principles—basic 15.3 % 7.3% $ 2.00 $ 1.77
Net income before changes in accounting principles—diluted 15.3 % 7.4% 2.00 1.77
Basic net income 15.3 % 7.3% 2.00 1.77
Diluted net income 15.3 % 7.4% 2.00 1.77
Cash dividends 9.3 % 9.9% 1.00 0.88
Market price on December 31, (6.5)% 4.9% 41.64 50.75
TOTAL MARKET VALUE OF COMMON STOCK1(7.0)% 4.3% $ 100,325 $ 123,908
BALANCE SHEET DATA
Cash, cash equivalents and current marketable securities $ 6,768 $ 3,482
Property, plant and equipment—net 6,091 6,097
Depreciation 715 667
Capital expenditures 755 812
Total assets 31,327 27,342
Long-term debt 1,157 2,517
Shareowners’ equity 15,935 14,090
NET CASH PROVIDED BY OPERATIONS $ 5,968 $ 5,456
1Refer to Glossary on pages 119 and 120.
2In 2004, we adopted FSP No. 106-2, ‘‘Accounting and Disclosure Requirements Related to Medicare Prescription Drug, Improvement
and Modernization Act of 2003.’’
3In 2003, we adopted SFAS No. 146, ‘‘Accounting for Costs Associated with Exit or Disposal Activities.’’
22