Coca Cola 2004 Annual Report Download - page 58
Download and view the complete annual report
Please find page 58 of the 2004 Coca Cola annual report below. You can navigate through the pages in the report by either clicking on the pages listed below, or by using the keyword search tool below to find specific information within the annual report.-
 1
1 -
2
-
3
-
4
-
5
-
6
-
7
-
8
-
9
-
10
-
11
-
12
-
13
-
14
-
15
-
16
-
17
-
18
-
19
-
20
-
21
-
22
-
23
-
24
-
25
-
26
-
27
-
28
-
29
-
30
-
31
-
32
-
33
-
34
-
35
-
36
-
37
-
38
-
39
-
40
-
41
-
42
-
43
-
44
-
45
-
46
-
47
-
 48
48 -
 49
49 -
 50
50 -
 51
51 -
 52
52 -
 53
53 -
 54
54 -
 55
55 -
 56
56 -
 57
57 -
 58
58 -
 59
59 -
 60
60 -
 61
61 -
 62
62 -
 63
63 -
 64
64 -
 65
65 -
 66
66 -
 67
67 -
 68
68 -
69
-
70
-
71
-
72
-
73
-
74
-
75
-
76
-
77
-
78
-
79
-
80
-
81
-
82
-
83
-
84
-
85
-
86
-
87
-
88
-
89
-
90
-
91
-
92
-
93
-
94
-
95
-
96
-
97
-
98
-
99
-
100
-
101
-
102
-
103
-
104
-
105
-
106
-
107
-
108
-
109
-
110
-
111
-
112
-
113
-
114
-
115
-
116
-
117
-
118
-
119
-
120
-
121
-
122
-
123
-
124
-
125
-
126
-
127
-
128
-
129
-
130
-
131
-
132
-
133
-
134
-
135
-
136
-
137
-
138
-
139
-
140
 |
 |

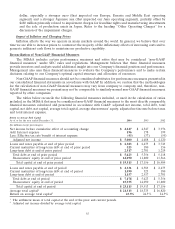
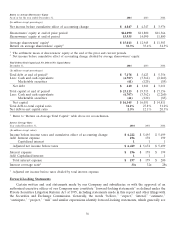
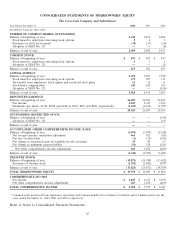
Return on Average Shareowners’ Equity
As of or for the year ended December 31, 2004 2003 2002
(In millions except percentages)
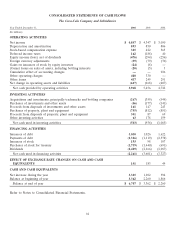
Net income before cumulative effect of accounting change $ 4,847 $ 4,347 $ 3,976
Shareowners’ equity at end of prior period $14,090 $11,800 $11,366
Shareowners’ equity at end of period 15,935 14,090 11,800
Average shareowners’ equity1$ 15,013 $ 12,945 $ 11,583
Return on average shareowners’ equity232.3% 33.6% 34.3%
1The arithmetic mean of shareowners’ equity at the end of the prior and current periods.
2Net income before cumulative effect of accounting change divided by average shareowners’ equity.
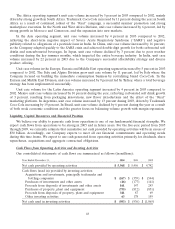
Total Debt-to-Total Capital and Net Debt-to-Net Capital Ratios
December 31, 2004 2003 2002
(In millions except percentages)
Total debt at end of period1$ 7,178 $ 5,423 $ 5,356
Less: Cash and cash equivalents (6,707) (3,362) (2,260)
Marketable securities (61) (120) (85)
Net debt $ 410 $ 1,941 $ 3,011
Total capital at end of period1$ 23,113 $ 19,513 $ 17,156
Less: Cash and cash equivalents (6,707) (3,362) (2,260)
Marketable securities (61) (120) (85)
Net capital $ 16,345 $ 16,031 $ 14,811
Total debt-to-total capital ratio 31.1% 27.8% 31.2%
Net debt-to-net capital ratio 2.5% 12.1% 20.3%
1Refer to ‘‘Return on Average Total Capital’’ table above for reconciliation.
Interest Coverage Ratio
Year ended December 31, 2004 2003 2002
(In millions except ratios)
Income before income taxes and cumulative effect of accounting change $ 6,222 $ 5,495 $ 5,499
Add: Interest expense 196 178 199
Capitalized interest 111
Adjusted net income before taxes $ 6,419 $ 5,674 $ 5,699
Interest expense $ 196 $ 178 $ 199
Add: Capitalized interest 111
Total interest expense $ 197 $ 179 $ 200
Interest coverage ratio133x 32x 28x
1Adjusted net income before taxes divided by total interest expense.
Forward-Looking Statements
Certain written and oral statements made by our Company and subsidiaries or with the approval of an
authorized executive officer of our Company may constitute ‘‘forward-looking statements’’ as defined under the
Private Securities Litigation Reform Act of 1995, including statements made in this report and other filings with
the Securities and Exchange Commission. Generally, the words ‘‘believe,’’ ‘‘expect,’’ ‘‘intend,’’ ‘‘estimate,’’
‘‘anticipate,’’ ‘‘project,’’ ‘‘will’’ and similar expressions identify forward-looking statements, which generally are
56