Coca Cola 2004 Annual Report Download - page 79
Download and view the complete annual report
Please find page 79 of the 2004 Coca Cola annual report below. You can navigate through the pages in the report by either clicking on the pages listed below, or by using the keyword search tool below to find specific information within the annual report.-
 1
1 -
2
-
3
-
4
-
5
-
6
-
7
-
8
-
9
-
10
-
11
-
12
-
13
-
14
-
15
-
16
-
17
-
18
-
19
-
20
-
21
-
22
-
23
-
24
-
25
-
26
-
27
-
28
-
29
-
30
-
31
-
32
-
33
-
34
-
35
-
36
-
37
-
38
-
39
-
40
-
41
-
42
-
43
-
44
-
45
-
46
-
47
-
48
-
49
-
50
-
51
-
52
-
53
-
54
-
55
-
56
-
57
-
58
-
59
-
60
-
61
-
62
-
63
-
64
-
65
-
66
-
67
-
68
-
 69
69 -
 70
70 -
 71
71 -
 72
72 -
 73
73 -
 74
74 -
 75
75 -
 76
76 -
 77
77 -
 78
78 -
 79
79 -
 80
80 -
 81
81 -
 82
82 -
 83
83 -
 84
84 -
 85
85 -
 86
86 -
 87
87 -
 88
88 -
 89
89 -
90
-
91
-
92
-
93
-
94
-
95
-
96
-
97
-
98
-
99
-
100
-
101
-
102
-
103
-
104
-
105
-
106
-
107
-
108
-
109
-
110
-
111
-
112
-
113
-
114
-
115
-
116
-
117
-
118
-
119
-
120
-
121
-
122
-
123
-
124
-
125
-
126
-
127
-
128
-
129
-
130
-
131
-
132
-
133
-
134
-
135
-
136
-
137
-
138
-
139
-
140
 |
 |

NOTES TO CONSOLIDATED FINANCIAL STATEMENTS
The Coca-Cola Company and Subsidiaries
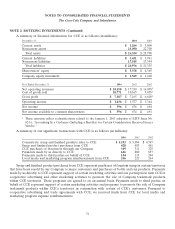
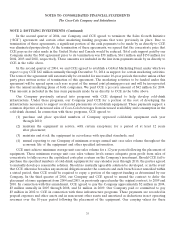
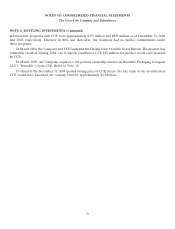
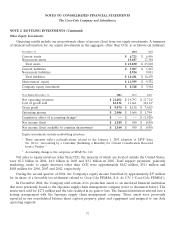
NOTE 2: BOTTLING INVESTMENTS (Continued)
Other Equity Investments
Operating results include our proportionate share of income (loss) from our equity investments. A summary
of financial information for our equity investments in the aggregate, other than CCE, is as follows (in millions):
December 31, 2004 2003
Current assets $ 6,723 $ 6,416
Noncurrent assets 19,107 17,394
Total assets $ 25,830 $ 23,810
Current liabilities $ 5,507 $ 5,467
Noncurrent liabilities 8,924 9,011
Total liabilities $ 14,431 $ 14,478
Shareowners’ equity $ 11,399 $ 9,332
Company equity investment $ 4,328 $ 3,964
Year Ended December 31, 2004 2003 2002
Net operating revenues $ 21,202 $ 19,797 $ 17,7141
Cost of goods sold 12,132 11,661 10,1121
Gross profit $ 9,070 $ 8,136 $ 7,6021
Operating income $ 2,406 $ 1,666 $ 1,744
Cumulative effect of accounting change2$—$ — $ (1,428)
Net income (loss) $ 1,389 $ 580 $ (630)
Net income (loss) available to common shareowners $ 1,364 $ 580 $ (630)
Equity investments include nonbottling investees.
1These amounts reflect reclassifications related to the January 1, 2003 adoption of EITF Issue
No. 02-16, ‘‘Accounting by a Customer (Including a Reseller) for Certain Consideration Received
from a Vendor.’’
2Accounting change is the adoption of SFAS No. 142.
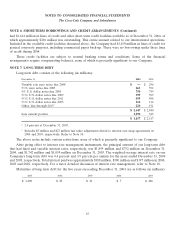
Net sales to equity investees other than CCE, the majority of which are located outside the United States,
were $5.2 billion in 2004, $4.0 billion in 2003 and $3.2 billion in 2002. Total support payments, primarily
marketing, made to equity investees other than CCE were approximately $442 million, $511 million and
$488 million for 2004, 2003 and 2002, respectively.
During the second quarter of 2004, the Company’s equity income benefited by approximately $37 million
for its share of a favorable tax settlement related to Coca-Cola FEMSA, S.A. de C.V. (‘‘Coca-Cola FEMSA’’).
In December 2004, the Company sold certain of its production assets to an unrelated financial institution
that were previously leased to the Japanese supply chain management company (refer to discussion below). The
assets were sold for $271 million and the sale resulted in no gain or loss. The financial institution entered into a
leasing arrangement with the Japanese supply chain management company. These assets were previously
reported in our consolidated balance sheet caption property, plant and equipment and assigned to our Asia
operating segment.
77